Showing posts with label baltic dry goods index. Show all posts

Monday, January 17, 2011

JANUARY MACRO UPDATE -

The January Update will be a bit abbreviated in the commentary today.  I'm slammed working on a few things, but most importantly I want to get this out since we're half way through the month.

TOTAL RAILS - http://railfax.transmatch.com/
Nothing new here, total rail traffic is an entire shift higher over 2010 levels. 

RAILS - AUTO SHIPPING -
Autos continue to be an area where we must be alert.  Shipments are at 2010 levels now and all the "recovery" has not been absorbed.  Perhaps the restocking is done and all of those great numbers reported by GM were the normal games played by car makers and dealers.  Is it time to short GM?  Admittedly, I have already been short GM several times last week.  If I have time I'll post a few charts on that stock, it looks like a great set up.


RAILS - SCRAP -
Similar to the tonnage of autos, scrap shipping is in decline.  The next month seasonally looks like we will have a tick up, if we don't we need to be looking for this to bleed into other areas.


CERIDIAN / UCLA FUEL INDEX - http://www.ceridianindex.com/
In the chart below we see that there are two data points that are lower and only one higher.  Let's dig into which is which.  First the UCLA Fuel Index (PCI) is reported lower again for November, the Industrial Production numbers too declined, but once again the Dow keeps moving higher.  Before we get too worried, the December release of the Fuel Index is significantly higher at a 109 level so the year end surge in Christmas stocking could have done the trick.  I'll continue to monitor this.


HOUSING - http://www.realtor.org/research/research/ehsdata
No real change in housing.  I continue to expect a further decline of 5% to 10% for the year of 2011.  As interest rates rise we will see yet another hindrance to the healing of the housing market.  In another event, GMAC was force drop cases against 10,000 foreclosures that were in process due to robo-signing debacle.  I bet that will help the housing market?  Karl has been on top of this and I won't go into any of this and repeat him.  http://www.market-ticker.org/akcs-www?post=177483


MIT / MOODY'S TRANSACTION PRICING - http://web.mit.edu/cre/research/credl/rca.html
A little move up in CRE transaction pricing.  All is good right?


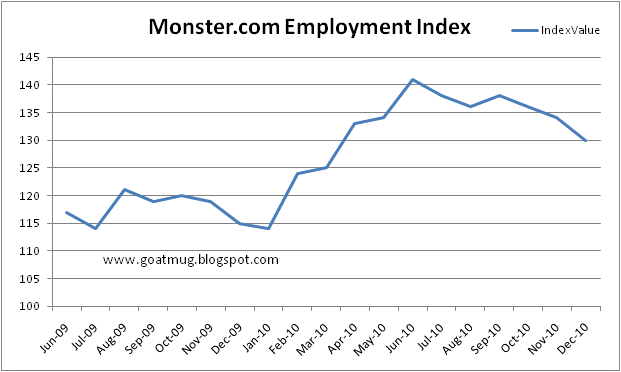
MONSTER.COM JOB INDEX - http://about-monster.com/employment-index
The Monster.com Job Index information was released and we continue to see a decline in the number of on-line job offerings.  Jobless numbers have been coming in higher than expected so we certainly need to keep an eye out for any continued weakness in the job numbers.

FOOD STAMPS - http://www.fns.usda.gov/pd/34SNAPmonthly.htm
Nothing new here, more and more folks coming to our government for assistance with basic needs.  For the month of October 300,000 more people were added to the roles.  Now it is critical to note that this increase is the lowest monthly percentage increase since February of 2010.  Hopefully the rate of change will continue to decline.


SCRAP METAL COMPOSITE INDEX - http://www.scrap.net/cgi-bin/composite_prices.cgi?id=100000&num=5
Not anything unexpected, scrap prices continue higher.


COPPOCK TURN INDICATOR -
The Coppoock Turn is still signaling a decline and would continue to do so until the DJIA marked 12,350.  While this may be a great long term indicator, you'd have missed almost 1,800 Dow points since June of 2010.  Now ultimately it may be correct, but I wouldn't hang my performance on this.  I'm continuing to post it here just to watch it and see what happens.


6 MONTH EURIBOR - http://www.homefinance.nl/english/international-interest-rates/euribor-interest-rates.asp
Euribor rates continue to climb - Everything all better in Europe?  I think not.


FINANCIAL CONDITIONS INDEX - http://www.bloomberg.com/apps/quote?ticker=BFCIUS:IND
The Bloomberg Financial Conditions Index is now fully over zero which signals an expansion.  Happy Days Are Here Again!  The move over zero indicates that the US economy is in an expansion, not a recession.


BALTIC DRY GOODS SHIPPING INDEX - http://www.bloomberg.com/apps/quote?ticker=BDIY:IND
The Baltic Dry Goods Shipping Index continues to move lower.  I'm convinced that this is the result of over capacity in the shipping industry.  Another thing that comes to mind is that there are rumors that business men and regular folks in China have been hording metals ranging from copper, iron, and more IN THEIR BACKYARDS!  I'm suggesting that we may be at the level where speculation has run its course and the BDI could be signaling that there is no real demand..  Of course the floods in Oz can't help as coal and other commodities certainly didn't get put on boats in the last week or so.


USD - http://www.bloomberg.com/apps/quote?ticker=DXY:IND
What's that?  The USD is starting to fall again?  Who would have thought that might happen?  Perceived threats to the Eurozone may have been fixed for another month or so and now we see that the dollar has continued its slide. 


TRADING UPDATE
The market continues to move higher but signs of topping are certainly unfolding.  As I mentioned last week in the 2011 Predictions note I fully expect some kind of correction here, but a final move higher into the end of April and May.  Having said that, markets do look toppy.

Specifically, I remarked above that I had been shorting GM all last week and I'll post the chart here.  I didn't annotate it here because there is no reason to.  You can clearly see that $39.00 was a point of overhead resistance.  This could easily drop to $35 in a simple overall market correction and that is how I've continued to play it.  Any move above $39.00 will stop me out.


Metals have been weak too as the ECB and Eurozone look to have solved all of their problems......(not).  Other than the agriculture areas that I highlighted in the 2011 Outlook, I also said that energy would be a place of great gains.  I mentioned XLE, and KOL, but I want you to examine UGA (gasoline).  If there is truly a trade for the first half of the year other than the "softs" I think gas is it.  I'm not writing about natural gas as I  hate the eft for it has been a killer for anyone holding it long term and many of you kow that I am fond of calling UNG the widow-maker  I am referring to the gas in your cars.  We have punched above old resistance at $40.00 and now I can see UGA move to $52.00 or higher as we get into the summer driving season.
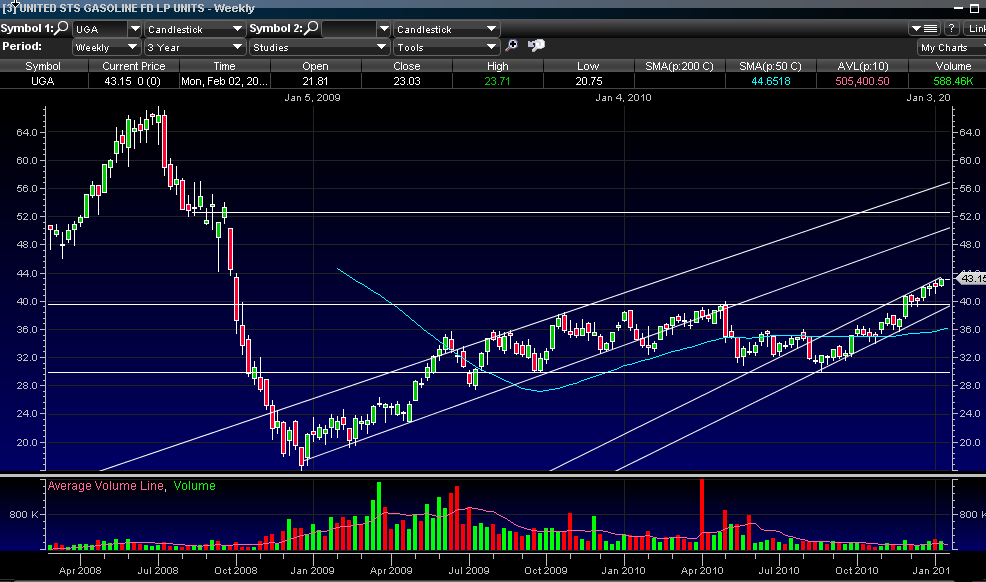


Finally, here is another view of UGA as it shows the 14 day EMA and the 40 day EMA.  This is a longer term indicator I use to show breakouts and breakdowns.  The crossing over of the 14 day EMA on this weekly chart shows that there is a lot of momentum here.  (Wish I would have been watching for this back at $36.00).  Also the CCI is showing that the trend is absolutely in the bullish camp.  A drop below 100 would tell us the momentum is gone.


In closing, overall macro trends are mixed, but I think the trader's technical set up is one for a correction.  Despite the negative feelings I have, the indices continue to push higher and higher even though individual story stocks are pretty nasty.  I made great money shorting last week with a major gain in shorting the rare earth element companies I've mentioned recently.  Earnings announcements for the last couple of quarters have been a "sell the news" event, so that too gives me more confidence to be on the short side.  Still, blindly shorting will probably yield the same results that we've seen for the last 18 months, so you need to target weakness and sprinkle in a little luck.  Perhaps that is what many shorts will receive today as I note that Steve Jobs is taking a leave of absence and the wonder company AAPL is down pretty big in Germany and Europe (market is closed in the US today).  This may provide the catalyst for the short term correction I've been looking for in the broader market, but I firmly believe that the dip will be bought and that is what I'll be doing in the areas I identified in the 2011 Outlook.

I'll leave you with one other chart here to underscore what I mean when I am looking for a correction. As I noted in last week's outlook several indicators have signaled just how overdone the rally has been without any hint of a reversal. Market breadth, put/call rations, AAII investor sentiment, and more show that bulls are not only complacent, they are outright crazy bullish. Times like these require, no, I mean demand some sort of adjustment to reign in the euphoria. I've often included work from my friend Guy Lerner from http://www.thetechnicaltake.com/ Below is a simple chart that reflects how bullish his investor indicator is (bottom portion of the graph - red line) and how this suggests that we should see a sizeable correction (holding breath waiting now....). Guy's work is always great and I highly recommend his paid site, it provides super information and is really cheap on the wallet.


BE CAREFUL!
GOATMUG

Monday, March 8, 2010

MARCH UPDATE

MONTHLY UPDATE


Rail data continues to show improvement in total tonnage shipped. Last week each category of shipments showed higher levels of cargo traffic than the previous year in except for coal shipments. In comparisons to last year's data, coal and lumber are the only categories that are lower than 2009.


LUMBER & STONE
As usual, we are watching lumber and crushed stone to tip us off for some sort of housing and commercial building growth. Lumber is at least pushing higher compared to last year while crushed stone still tells us that commercial building is mired in the pit.


We want to watch what CFO's of companies are thinking and how they are feeling to give us an understanding of where they predict the economy may go. I like CFO's more than CEO's because typically CFO's are a conservative lot that see what is actually going on in the firm rather than projecting what may happen. In fact, CFO's typically downplay the strength of the company and I like that as they tend to reign in spending and the projections of the sales team.

A professor from Duke interprets the data here......

"The uptick in business spending indicates the economy has bottomed out. But the recovery might be short-lived if the employment picture does not begin to improve," Graham added. "Another note of concern is the corporate sector’s expectation to decrease inventories, exerting downward pressure on overall GDP growth."


EMPLOYMENT STABILIZING, BUT INVENTORIES TO DECLINE
About half of U.S. CFOs say they will increase full-time domestic employment in the next year, twice as many as say they will decrease their workforce. Net full-time employment is expected to increase 0.2 percent and temporary employment 0.5 percent. Finance chiefs expect outsourcing to rise nearly 4 percent.
"Certainly, it is good news that the employment bleeding has stopped," said John Graham, professor of finance at Duke’s Fuqua School of Business and director of the survey. "CFOs, however, still expect a virtually jobless recovery in 2010. Looking further ahead, it will be two to three years, maybe longer, before employment returns to pre-recession levels at most firms. CFOs say they are keeping workforces low due to weak consumer demand and increased efficiency in their production processes."

-- CFOs’ top economy-wide concerns include weak consumer demand, federal government policies, price pressure and credit markets. Top concerns about their own businesses include maintaining profit margins, low employee morale and liquidity management


No double dip - WLI data back up after 4 weeks of decline. Now at 129.8, the WLI is showing continuing strength in the recovery.


FINANCIAL CONDITIONS INDEX - http://www.bloomberg.com/


Like the WLI, the FCI is now solidly above 0 and this tells us that the "recession" is over. We will need to continue to watch the jobs data as this will be the issue that drags the economy down if people don't find jobs. As we marry this concept with what the CFO's are saying in the sentiment data above, we need to make sure that we are enjoying the "recovery", but are skeptical of it at the same time. CFO's are telling us that they are going to actually decrease employment and outsource more of their jobs overseas. That doesn't lend support to the notion that the consumer is back and that housing is fixed.


Speaking of housing, we are seeing pricing declines. While this sounds bad, pricing drops are the only way to make homes more affordable and accessible to buyers. Lower prices will help clear the shadow inventory of homes that will continue to suppress a recovery. Why our government continues to delay this is a mystery when we all know that the only way to fix the sickness is to take the medicine.


BALTIC DRY GOODS INDEX- http://www.bloomberg.com/

I've been watching the BDGI lately alot as an indication of activity of shipping in overseas markets. Spot shipping rates (not contracted ones, but the rate that you'd have to pay if you needed to ship something and lease your ship today on the open market) are moving higher, moving up some 10% from last month's report. A continued move here may bode well for some shippers. An acquaintance on www.slopeofhope.com sent me an article on how the pricing changes in the baltic dry goods index is not that connected to the pricing of the actual shippers, but no matter if that is true, this does indicate that commodities themselves are being consumed and moved. This bodes well for the continued move higher in emerging markets, basic industries, and commodities.


The dance continues. As we have concerns over debt defaults in countries like Greece, Spain, Portugal and Ireland, we see strength in the USD. When we get word that the EU, IMF, or Germans are going to bailout these countries, we then get a flight from the dollar and a recovery in equity markets. There has been some breakdown in the traditional relationship because not only are European investors fleeing the euro and other currencies, they are also simply buying US equities as well. This is why we've actually had some equity market strength in the face of concerns over Greece's sovereign debt problem. The nasty little secret is that all of these countries have been hiding debt and this is just coming to light. We will have a debt crisis, national governments are simply trying to do what they have done forever, ----keep the charade going as long as possible.

A story released this weekend is suggesting that Dubai actually has nearly 4x's as much debt as every thought as they have hid it. Doesn't that make you feel cozy inside to thing that national governments would like to their investors and debt holders? Why would banks and people follow laws and be honest if their governments don't lead by example.


Longer term, I still expect the dollar to rise and treasury rates to go higher as well. In the short run if we get a "solution" to the Greece issue, we'll see the USD drop.


TRADING UPDATE FOR MARCH
We've continued to rally since February 5th. I am still positive for the next month and 1/2 or two, but I am waiting to see a very slight pullback as investors will get overly bullish and everyone will lean to a specific side. Economic data will continue to surprise folks on the upside (jobs, housing sales, retail sales) and this could push the market higher. In addition, the resolution to the situation with the debt problems in Greece - although this is temporary because more countries face trouble. In spite of the negative potential news, slight pull backs have been tough to come by, so a good strategy may be to add purchases in an incremental fashion. Traders often call these time stops. Perhaps the timing could be to add every 2 weeks or every month. This way you don't put your entire holdings in at once.
WARNING - THE FOLLOWING ARE SPECULATIVE TRADES -
Emerging Markets - As we see continued USD weakness, we'll see momentum build in the emerging markets. I have had the following trade on for some time, but it just broke out today and I think it still has close to $1.00 more to run before hitting resistance.
EWM - Malaysia
Current - $11.30
Target $12.35 (Target Gain = 8.8%)
Downside stop - $10.50 (potential loss -7.1%)

Oil - I think oil continues to breakout. We are now above $80. As I stated in the beginning of the year, I believe we have a shot at $100.
GOLD - GLD - For a short time horizon, I believe gold is going higher. I am personally not involved in this trade and am not going to provide levels for a trade on this item despite it's positive direction. You can comment and leave me levels and I'll take a look to confirm it if you'd like.
(VXX) - (BEARISH TRADE FOR A PULLBACK) VIX is now at 17.8 as I am writing this. I do believe we could have a short term pullback and the use of VXX to play that would be ok. This is not a long term trade, you are simply trying to capture any downside as we've moved quite far since Feb 5th without a significant fall. Take a look at thetechnicaltake.com . Guy Lerner is again stating that bullishness is high and this should give us some validation to the notion that we'll make money as the fear index reverses and goes higher - making money in the VXX.

KSU - KSU is now trading above $35.00. I like the gains we took on it, and will wait to re-enter.
As usual, thanks for visiting and thanks for your comments.
Goatmug