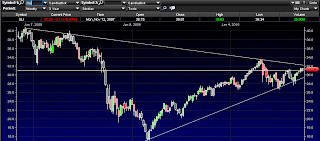
I can't stand it anymore! After this record advance in September everyone is bullish. Investor sentiment is bullish, CNBC is bullish, even I am bullish (actually have been since late July). Perhaps I simply am a rebel and must feel like I'm marching to a different drum beat, but upon waking this morning I embarked on a mission to prove or disprove the case for the rampant optimism I'm seeing everywhere. While I'd normally provide chart upon chart of manipulated macro economic data I simply started drawing lines on 3 year weekly charts. I'll keep the commentary to a minimum, but leave you with a string of charts that highlight significant markets I follow. Please note, I will indicate several areas I'm watching for a breakout, but to be honest we've seen a pattern of breakouts through important levels where everyone is watching just to see significant reversals once everyone gets on board. . I'm putting these levels in my system so I can be alerted and watching for continued momentum that is maintained.
SPX (The 1150 level still seems to be resistance) - no breakout yet.
XLE (Energy) - Watching $56.50 here.
XLI (Industrials)- XLI looks like it has poked its head above resistance. There is that long term downward sloping trendline still overhead, but this tells me that XLI could run another dollar or so before testing this.
SMH (Semi-conductors) - $28.75 would be interesting as this has not broken out yet
XLF (Financials) - I posted this chart last week and it has been very helpful in showing that there is no breakout in financials. There was a punch through to $15 and a quick reversal back inside the trendline. Of all the charts I'm posting, I think this is one of the most useful.
LQD - Investment Grade Corporate Bonds-(Breakout has obviously occurred. In fact, we should expect a drop back into that long term channel, however corporate bonds have been the beneficiary of much of the government's attempts to force investors to increase their risk and drive them out of CDs and money markets. Traditionally, we'd expect the equity markets to rally when LQD goes lower, however that typical correlation has been on hold since May 2008 when all asset values collapsed and enjoyed a subsequent rise from the ashes.
LQD with SPX overlay -Has LQD rallied too far and does a correction in bonds suggest more upside for the $SPX?
SLV - (Silver) - Sure, this is clearly a breakout! SLV is above its previous peak of $20.65. I'm still not selling my holdings of physical silver here, but I'm certainly not adding any SLV at this level.
JJC - (Copper) - Yes, breakout has happened.
EEM - (Emerging Markets) - Yes, this too is clearly a breakout. Since late July I've advocated holdings in emerging markets based on the comparison of GDP growth rates in these countries to our weak US growth and also the specter of QE2 which is targeting the devaluation of the dollar. It appears there is significant room to run here.
TLT (20 Year Treasury Bonds) - Risk on or risk off, the Fed's intervention in the treasury markets will in my opinion put a floor on TLT for some time. While interest rates SHOULD be rising here it is clear that this operation is more of a budgetary mechanism to ensure we can actually pay our bills. The Fed and Treasury Department cannot allow rates to creep higher or else we face significant issues.
TRADING SUMMARY -
Well, that's it, I hope this summary of charts gives you a view of areas that we should be watching for the upside or a reversal. Many key areas are close to upside breakouts and we're seeing continued momentum in precious metals and emerging markets. XLF (financials) continues to look weak and this is going to be a key indicator for me to watch (it always is). It is almost as though XLF is telegraphing to us that something is going on and the story just hasn't hit the headlines yet..
IS THE BULLISHNESS WARRANTED?
The obvious answer is - perhaps! In terms of economic reasons I doubt it, but that was not the focus of this post. For me, this exercise has confirmed that we really are in a significant area here that could propel us to much higher levels. I would not be amazed to see a move through these levels, but I'm also aware that we are simply at the top of the trading range we've endured for almost one year.
The bear in me looks at these overhead resistance levels as good areas to enter shorts and allow for some room for a bust-through and reversal. The tinfoil hat wearing trader in me thinks we could see more positive action ahead.
Be Careful -
GOATMUG
Wednesday, September 29, 2010
Subscribe to:
Comments (Atom)


