Showing posts with label GM. Show all posts

Friday, July 22, 2011

I THOUGHT WE MADE MONEY ON THE BAILOUTS....

More great news from our government!

Chrysler bailout hands the US $1.4 Billion in losses.

We are now getting details about the cost of the bailouts from the last several years that were made to various industries.  As I think through this, I am still torn regarding the use of taxpayer money to attempt to save private industry.  It doesn't escape me that these businesses are huge employers and these firms are in the manufacturing area of the economy.  Yes, this is the exact area that I continually say we need, however I would feel better about the entire mess if the recipients of the government help were truly made clean and whole.  In addition, I'd feel better if these firms were non-union firms because the existence of these unions simply means that these companies will be broke again in a few years.  Interestingly, most of the firms that did receive most of the bailouts (outside of banks of course) were all unionized firms.  Further, my feeling is that we essentially stepped in to help extend the life of failing businesses that were uncompetitive, not creative, and not managed to remain in business. 

LOSERS ARE HAPPY ABOUT LOSING
The story I've highlighted draws out that the Chrysler bailout will end up costing Americans $1.34 billion.  At the end of the day, Chrysler was sold to Fiat and now control of the firm in not in US hands any more.  Below are a few quotes from the story above;  
"As part of the loan agreement, Chrysler was given until 2017 to return the bailout funds. If it had taken the full term, the interest accrued on the loans could have significantly reduced the government's losses.  (BUT IT DIDN'T DID IT?!)

Overall, $1.3 billion will not be recovered from the bankrupt Old Chrysler, but Massad still called it a "major accomplishment."
That's because the government originally expected it would lose much more on the auto bailout. Initial estimates from the Congressional Budget Office in 2009, predicted the government would lose $40 billion on the overall auto bailout.
Now it estimates, by the time the $80 billion program is completely wrapped up, taxpayers will have lost $14 billion."
I don't know about you, but I don't recall any Treasury official or any politician telling me we would lose money on any bailout.  I certainly don't recall hearing President Obama telling us that we were going to lose $40 Billion!  Only a government worker can be happy about losing $1.3 billion and consider it a success.

While we didn't lose $40 Billion we are probably going to lose $14 billion.  In government circles, that is nothing, but isn't that the problem with Washington?  Part of the Patient Protection Act of 2009 implemented a requirement to force business owners to produce 1099's for any purchases they made that were over the amount of $600.  The purpose of this legislation was to try to catch small business owners that did not recognize cash income.  Thankfully, this facet of the legislation was removed as lawmakers heard from businesses about the trouble and hardship it would place on them.  Guess how much that was going to raise in IRS revenue?  $17 billion!  So think about it, we are happy about losing $14 billion while in a blink of an eye the government was going to create a nightmare for small business, essentially creating piles of paperwork, and putting a strain on EVERY business in the USA for almost the same amount as we are happy to lose on the auto bailouts. 
GM'S A SUCCESS ISN'T IT?
Of course we are not done with the losses.  Remember GM?  We were planning on unloading the stock we received from that IPO as a result of their bailout, but since going public, GM stock has traded under it's IPO price.
"Treasury Department is now likely to wait until mid-August or September to hold a secondary offering for the company’s stock, people with knowledge of the matter said previously. At the initial public offering price of $33, Treasury must now sell the remainder of its shares at an average of $53 to break even."

 
Hmmm.  I'm not sure if we're going to see $53 any time soon.  What about you?

GOATMUG


Goatmug is an investor that cares about you and your family. Goatmug's Blog - Financial Perspectives From The Mountain Top is a collection of thoughts on our economy and how it impacts the lives of investors and average people. While several specific investments are named in many of his posts, these articles are simply invitations for you to do your own research and reference to these securities does not constitute financial advice. Your situation is complex and unique and you should seek professional assistance with your trading and investing. Please visit Goatmug and share your comments at http://www.goatmug.blogspot.com/

Monday, January 17, 2011

JANUARY MACRO UPDATE -

The January Update will be a bit abbreviated in the commentary today.  I'm slammed working on a few things, but most importantly I want to get this out since we're half way through the month.

TOTAL RAILS - http://railfax.transmatch.com/
Nothing new here, total rail traffic is an entire shift higher over 2010 levels. 

RAILS - AUTO SHIPPING -
Autos continue to be an area where we must be alert.  Shipments are at 2010 levels now and all the "recovery" has not been absorbed.  Perhaps the restocking is done and all of those great numbers reported by GM were the normal games played by car makers and dealers.  Is it time to short GM?  Admittedly, I have already been short GM several times last week.  If I have time I'll post a few charts on that stock, it looks like a great set up.


RAILS - SCRAP -
Similar to the tonnage of autos, scrap shipping is in decline.  The next month seasonally looks like we will have a tick up, if we don't we need to be looking for this to bleed into other areas.


CERIDIAN / UCLA FUEL INDEX - http://www.ceridianindex.com/
In the chart below we see that there are two data points that are lower and only one higher.  Let's dig into which is which.  First the UCLA Fuel Index (PCI) is reported lower again for November, the Industrial Production numbers too declined, but once again the Dow keeps moving higher.  Before we get too worried, the December release of the Fuel Index is significantly higher at a 109 level so the year end surge in Christmas stocking could have done the trick.  I'll continue to monitor this.


HOUSING - http://www.realtor.org/research/research/ehsdata
No real change in housing.  I continue to expect a further decline of 5% to 10% for the year of 2011.  As interest rates rise we will see yet another hindrance to the healing of the housing market.  In another event, GMAC was force drop cases against 10,000 foreclosures that were in process due to robo-signing debacle.  I bet that will help the housing market?  Karl has been on top of this and I won't go into any of this and repeat him.  http://www.market-ticker.org/akcs-www?post=177483


MIT / MOODY'S TRANSACTION PRICING - http://web.mit.edu/cre/research/credl/rca.html
A little move up in CRE transaction pricing.  All is good right?


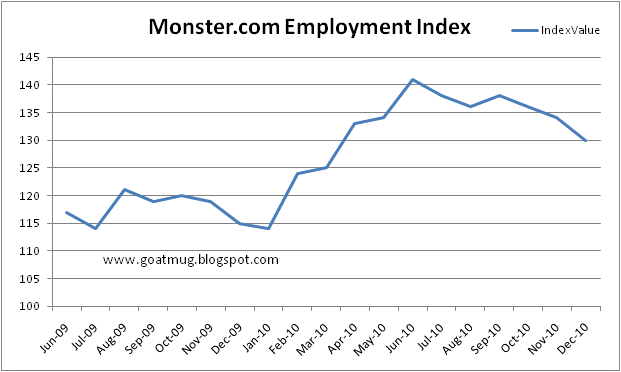
MONSTER.COM JOB INDEX - http://about-monster.com/employment-index
The Monster.com Job Index information was released and we continue to see a decline in the number of on-line job offerings.  Jobless numbers have been coming in higher than expected so we certainly need to keep an eye out for any continued weakness in the job numbers.


FOOD STAMPS - http://www.fns.usda.gov/pd/34SNAPmonthly.htm
Nothing new here, more and more folks coming to our government for assistance with basic needs.  For the month of October 300,000 more people were added to the roles.  Now it is critical to note that this increase is the lowest monthly percentage increase since February of 2010.  Hopefully the rate of change will continue to decline.


SCRAP METAL COMPOSITE INDEX - http://www.scrap.net/cgi-bin/composite_prices.cgi?id=100000&num=5
Not anything unexpected, scrap prices continue higher.


COPPOCK TURN INDICATOR -
The Coppoock Turn is still signaling a decline and would continue to do so until the DJIA marked 12,350.  While this may be a great long term indicator, you'd have missed almost 1,800 Dow points since June of 2010.  Now ultimately it may be correct, but I wouldn't hang my performance on this.  I'm continuing to post it here just to watch it and see what happens.


6 MONTH EURIBOR - http://www.homefinance.nl/english/international-interest-rates/euribor-interest-rates.asp
Euribor rates continue to climb - Everything all better in Europe?  I think not.


FINANCIAL CONDITIONS INDEX - http://www.bloomberg.com/apps/quote?ticker=BFCIUS:IND
The Bloomberg Financial Conditions Index is now fully over zero which signals an expansion.  Happy Days Are Here Again!  The move over zero indicates that the US economy is in an expansion, not a recession.


BALTIC DRY GOODS SHIPPING INDEX - http://www.bloomberg.com/apps/quote?ticker=BDIY:IND
The Baltic Dry Goods Shipping Index continues to move lower.  I'm convinced that this is the result of over capacity in the shipping industry.  Another thing that comes to mind is that there are rumors that business men and regular folks in China have been hording metals ranging from copper, iron, and more IN THEIR BACKYARDS!  I'm suggesting that we may be at the level where speculation has run its course and the BDI could be signaling that there is no real demand..  Of course the floods in Oz can't help as coal and other commodities certainly didn't get put on boats in the last week or so.


USD - http://www.bloomberg.com/apps/quote?ticker=DXY:IND
What's that?  The USD is starting to fall again?  Who would have thought that might happen?  Perceived threats to the Eurozone may have been fixed for another month or so and now we see that the dollar has continued its slide. 


TRADING UPDATE
The market continues to move higher but signs of topping are certainly unfolding.  As I mentioned last week in the 2011 Predictions note I fully expect some kind of correction here, but a final move higher into the end of April and May.  Having said that, markets do look toppy.

Specifically, I remarked above that I had been shorting GM all last week and I'll post the chart here.  I didn't annotate it here because there is no reason to.  You can clearly see that $39.00 was a point of overhead resistance.  This could easily drop to $35 in a simple overall market correction and that is how I've continued to play it.  Any move above $39.00 will stop me out.


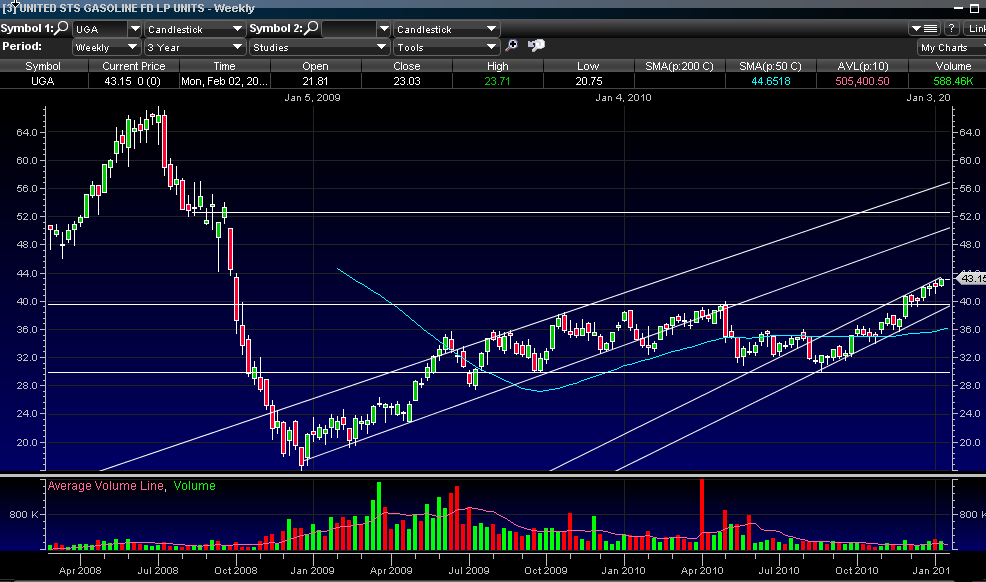
Metals have been weak too as the ECB and Eurozone look to have solved all of their problems......(not).  Other than the agriculture areas that I highlighted in the 2011 Outlook, I also said that energy would be a place of great gains.  I mentioned XLE, and KOL, but I want you to examine UGA (gasoline).  If there is truly a trade for the first half of the year other than the "softs" I think gas is it.  I'm not writing about natural gas as I  hate the eft for it has been a killer for anyone holding it long term and many of you kow that I am fond of calling UNG the widow-maker  I am referring to the gas in your cars.  We have punched above old resistance at $40.00 and now I can see UGA move to $52.00 or higher as we get into the summer driving season.


Finally, here is another view of UGA as it shows the 14 day EMA and the 40 day EMA.  This is a longer term indicator I use to show breakouts and breakdowns.  The crossing over of the 14 day EMA on this weekly chart shows that there is a lot of momentum here.  (Wish I would have been watching for this back at $36.00).  Also the CCI is showing that the trend is absolutely in the bullish camp.  A drop below 100 would tell us the momentum is gone.


In closing, overall macro trends are mixed, but I think the trader's technical set up is one for a correction.  Despite the negative feelings I have, the indices continue to push higher and higher even though individual story stocks are pretty nasty.  I made great money shorting last week with a major gain in shorting the rare earth element companies I've mentioned recently.  Earnings announcements for the last couple of quarters have been a "sell the news" event, so that too gives me more confidence to be on the short side.  Still, blindly shorting will probably yield the same results that we've seen for the last 18 months, so you need to target weakness and sprinkle in a little luck.  Perhaps that is what many shorts will receive today as I note that Steve Jobs is taking a leave of absence and the wonder company AAPL is down pretty big in Germany and Europe (market is closed in the US today).  This may provide the catalyst for the short term correction I've been looking for in the broader market, but I firmly believe that the dip will be bought and that is what I'll be doing in the areas I identified in the 2011 Outlook.

I'll leave you with one other chart here to underscore what I mean when I am looking for a correction. As I noted in last week's outlook several indicators have signaled just how overdone the rally has been without any hint of a reversal. Market breadth, put/call rations, AAII investor sentiment, and more show that bulls are not only complacent, they are outright crazy bullish. Times like these require, no, I mean demand some sort of adjustment to reign in the euphoria. I've often included work from my friend Guy Lerner from http://www.thetechnicaltake.com/ Below is a simple chart that reflects how bullish his investor indicator is (bottom portion of the graph - red line) and how this suggests that we should see a sizeable correction (holding breath waiting now....). Guy's work is always great and I highly recommend his paid site, it provides super information and is really cheap on the wallet.


BE CAREFUL!
GOATMUG