Showing posts with label SPX. Show all posts

Wednesday, February 19, 2014

WHAT COMES NEXT? (BID & MACRO VIEW)


Without any commentary..... what do you think comes next?


GOATMUG

Goatmug is an investor that cares about you and your family. Goatmug's Blog - Financial Perspectives From The Mountain Top is a collection of thoughts on our economy and how it impacts the lives of investors and average people. While several specific investments are named in many of his posts, these articles are simply invitations for you to do your own research and reference to these securities does not constitute financial advice. Your situation is complex and unique and you should seek professional assistance with your trading and investing. Please visit Goatmug and share your comments at http://www.goatmug.com/

Thursday, May 2, 2013

MACRO UPDATE - Sotheby's (BID)


Over the years I've highlighted a few of the major "turning point" indicators I've watched over the course of my involvement with the equity markets.  One of those that I found years back was the relationship that has held between the overall markets and that of Sotheby's.  I guess Sotheby's is a perfect example of disposable income at its best sort of like a Tiffany's or other high end retailer.

The redish line is (BID), while I've added the SPX behind in black.  BID seems to be an early turn indicator in the last two major swoons in early 1999 and also in late 2007, I've marked those in blue.  Late in 2012 again has presented us with a major turn signal where BID certainly has fallen, yet in this Fed stimulated world.... SPX continues to fly (marked in red at the far right of the chart).


While the overall markets "should" according to this two instance example begin to turn, it might just be a safer bet to short BID and just forget about shorting the overall market.  Are we even allowed to short anything?  Tomorrow's employment report will be interesting as we've heard from the Fed that they are willing and able to pump to the moon, as labor participation rates continue to decline, unemployment figures seem to improve as well.  I'm very interested to see what happens when the unemployment trap is set and the Fed needs to restate that they didn't really mean that they would really stop stimulating when the unemployment rate actually gets in the high 6% range.

 As with everything, I'm sure we'll just have a new set of rules or a new boogey man that will require unlimited printing and liquidity-less liquidity.


GOATMUG

Goatmug is an investor that cares about you and your family. Goatmug's Blog - Financial Perspectives From The Mountain Top is a collection of thoughts on our economy and how it impacts the lives of investors and average people. While several specific investments are named in many of his posts, these articles are simply invitations for you to do your own research and reference to these securities does not constitute financial advice. Your situation is complex and unique and you should seek professional assistance with your trading and investing. Please visit Goatmug and share your comments athttp://www.goatmug.blogspot.com/

Wednesday, April 17, 2013

RECOUPLING....T-BOND REVIEW (TLT,TBF, XLU)

I've posted a number of charts in the past months that examined the amazing experience we had in 2012 where typical market relationships melted into nothing and became completely useless.  One old notion that treasuries acted inversely to the equity markets was one of these.  In 2012, we witnessed treasuries increasing in value (yields falling) and equities rising, frankly, this isn't normal.

We've speculated as to why this happened, but without fail we always came back to, "Fed manipulation" as the key distorting factor.  Is it really that foreign investors needed safe sovereign holdings and continued to by US bonds without regard for yield?  Maybe.  Was it that Joe 6 Pack was abandoning his fear and rushing headlong into the equity market.  Possibly, with a portion of his holdings.  Each answer may be correct as the Fed's insatiable desire to buy up mortgages and treasuries has artificially suppressed yields and also forced Grandma and pension managers to elect for riskier assets with "new" money in an attempt to make something.  I think this is why our equity leadership has been focused like a laser in dividend paying stocks in defensive sectors.  The average investor doesn't trust this rally and hasn't, so as he holds his nose he buys utilities, consumer staples, and healthcare and shuns small caps and technology.

Don't think utilities have been a safe-haven?  Check this out.  I haven't sold my XLU yet, but is is on the agenda.


As 2013 dawned, we've seen a recoupling of the old relationship in the first few months, and I for one, am very happy.  Yet, as happy as I have been, an odd sense of dread kicked in as the relationship over the last few weeks started to break down.  Perhaps it was Cyprus, or perhaps the huge rally in the first quarter just needed a breather, but bond yields started floating lower, yet the equity markets just continued to press higher and float out in space to new highs.  I 've highlighted the chart of TBF (which is the etf that shorts treasuries which shows the relationships I've been watching).  In this chart, TBF should move in lock-step with the equity market (SPX) which is the black line behind the TBF chart.

A month or so ago I put this chart up and called for a change in direction for the stock market, but it didn't come.  The weakness in TBF suggests that a healthy correction is in store for stock markets.


Don't get too bearish and over extended here, but certainly the chart suggests a bit lower in equity markets.


GOATMUG

Goatmug is an investor that cares about you and your family. Goatmug's Blog - Financial Perspectives From The Mountain Top is a collection of thoughts on our economy and how it impacts the lives of investors and average people. While several specific investments are named in many of his posts, these articles are simply invitations for you to do your own research and reference to these securities does not constitute financial advice. Your situation is complex and unique and you should seek professional assistance with your trading and investing. Please visit Goatmug and share your comments athttp://www.goatmug.blogspot.com/

Thursday, February 21, 2013

THE TURN?


Here is an interesting chart I've posted before showing the XLU as a ratio vs SPX (defensive utilities versus market) and the SPX is also shown here.  If you follow the logic, market participants seek safety and more defensive holdings and sell the market in scary times.  They sell their defensive stuff and go into the market when they are bullish leading to a decline in the XLU:SPX relationship.

We appear to see a turn here where investors have begun looking for safety instead of a face-ripping rally.  Hope Joe 6 Pack didn't get all in last month.


GOATMUG

Goatmug is an investor that cares about you and your family. Goatmug's Blog - Financial Perspectives From The Mountain Top is a collection of thoughts on our economy and how it impacts the lives of investors and average people. While several specific investments are named in many of his posts, these articles are simply invitations for you to do your own research and reference to these securities does not constitute financial advice. Your situation is complex and unique and you should seek professional assistance with your trading and investing. Please visit Goatmug and share your comments athttp://www.goatmug.blogspot.com/

Wednesday, October 10, 2012

HISTORICAL VIEW - TRANSPORTS AND TULIPS

BLAME IT ON THE BOTS
Late last month I penned a posted titled, "5% Drop in the Transports Dead Ahead".  Like many of the posts that I hang out there, the HFT bots must have read the headlines and conspired to make me look a bit foolish on timing as the market has been able to tread water and the transports didn't immediately lose 5% with 3 minutes of posting like it should have!

STRONG RELATIONSHIPS
Seriously though, as soon as I posted it, I began to look at the action in the transports over longer time frames and make some notes that I wanted to share.  The first point I wanted to show is that the transports are important!  There is a pretty strong relationship between the transports and the stock market, and darn it, between the real economy too.  While I remind myself daily that the stock market is not the economy and the other way around, in longer term time frames the economy does matter to the market.  Ben Bernanke seems to think so as well, since he believes strongly that the market can drive the economy.  If he didn't, he wouldn't have spent trillions increasing his balance sheet to buy treasuries and MBS to make everyone feel like the economy is better.  Remember, feelings may lead to reality....he hopes.

I  think I have to reinforce here that the transports really are the ultimate indicator of the real economy, thus I have often posted the rail traffic and tonnage data in past years when it was easier for me to post. That is the important linkage, that at the end of the day, rails and freight and air deliveries are a direct result of the production and health of the economy.  If UPS, Fed Ex, Con-Way, JB Hunt, and Kansas City Southern all show a slowdown, my guess is that the general economy is slowing down.  Stocks will typically try to predict that slowdown unless there is some process that interferes with the pricing discovery in the market (QE3 anyone?).

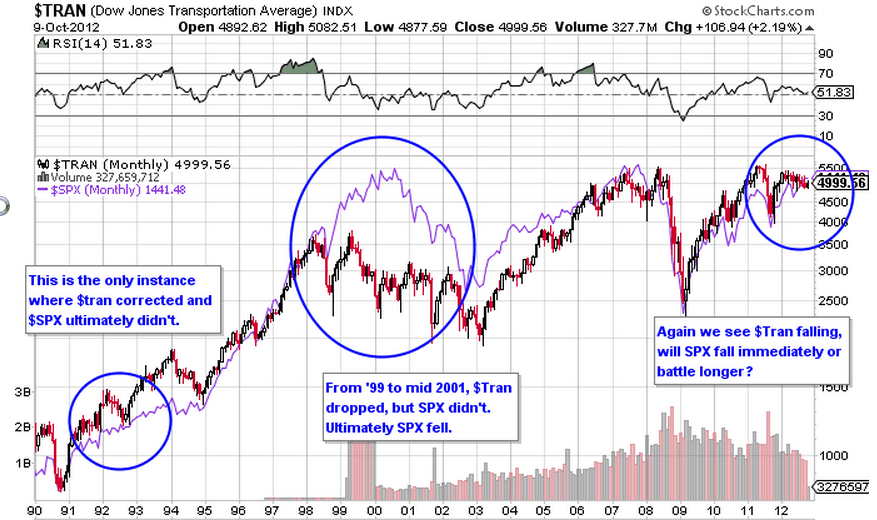
So, where are we going?  Check out this chart which contains twenty years worth of prices for the transports.  In the back ground of the chart I have included the SPX in purple.


DIVERGENCES AND HOW THEY PLAY OUT
I searched this chart in an attempt to find periods of time where the transports declined, but the SPX did not.  Previously, we had an instance in 1992 where the transports dropped for almost an entire year and the SPX simply moved sideways to higher.  At the beginning of 1993, the transports ripped much higher.  This seems to be the one point of divergence that wasn't corrected.

TULIP MANIA
The other significant period where the transports dropped and the SPX did not was the time frame from early 1999 to early 2000.  This of course was the blow off top of the tech bubble where you were an idiot if you didn't have your entire net worth wrapped up in CMGI, JDSU, Peapod and Pets.com.  During that phase, transports fell and the SPX ramped higher.  We all know that in March 2000, reality somehow interjected itself into the market frenzy and despite the rally in the summer, Mop and Pop ultimately ended up holding the bag for the great tech swindle.  

TRADING UPDATE
So, the point of my post here is not to revise my article stating that the transports were going to decline 5%.  In fact, this breather serves to reinforce that exact notion that the transports are tired and cannot generate enough momentum to break overhead resistance.  The tired trading is shown here below and I still look to 4700 as the target for the transports.  Additionally, I have to highlight that the 14 day EMA is now well below the 40 day EMA.  This is entirely bearish from a longer-term swing trade view for the transports.  The question we need to ask ourselves is, "Is this 1992, or is this 1999.  Let's hope it's 1992, because I don't think Mom and Pop can stand another summer of 2000.


GOATMUG

Goatmug is an investor that cares about you and your family. Goatmug's Blog - Financial Perspectives From The Mountain Top is a collection of thoughts on our economy and how it impacts the lives of investors and average people. While several specific investments are named in many of his posts, these articles are simply invitations for you to do your own research and reference to these securities does not constitute financial advice. Your situation is complex and unique and you should seek professional assistance with your trading and investing. Please visit Goatmug and share your comments athttp://www.goatmug.blogspot.com/

Wednesday, March 3, 2010

CAN THE "FEAR INDEX GUIDE US?" - VIX REVISITED

Just a quick note about our old friend the VIX. We've rallied back quite well and all still seems to be going according to the plan we've laid out where we see some strength in the market for the next 6 weeks or so. Now the jobs report could come out extremely weak since (and blame it on the snow of course!) but still there does seem to be strength in the market in a broad based rally that has included home builders, retailers, technology, metals, commodities, and energy.
Despite things going as planned, I am still cautious and looking for indicators in the market that may give us a warning that the run is over done.


I have noticed that transports like KSU seemed to have hit the wall over the last two days, so that may be an indication of some weakness or some consolidation. As you know, the KSU trade in my opinion has past and I sold out of that earlier. Some might say too early, but 10% gains in little over a week are great and I didn't want to give them back. Having said that there has been some real stiff resistance right at the $35 area where I highlighted in the chart. By the way, don't over do your trade size. I received a comment from a visitor that told me that he had completed the KSU trade and it was HUGE. Do not purchase a particular stock in such a large portion that it becomes a significant or oversized holding in your portfolio. You must manage risk in many ways and the worst thing you can do is to take too large of a position.


Anyway, I mentioned that P/Es were way too high the other day and another item I'm watching is the VIX. The VIX is the fear index or really a measure of the volatility in the market. Since February 5th the market has pretty much rocketed in one direction and therefore fear has almost disappeared. As usual, my friend Guy Lerner at thetechnicaltake.com has highlighted that the smart money and insiders are beginning to sell and the dumb money is very bullish. These are the times we need to wake up! The VIX is now reading 18.83 and this is an indication of complacency in the market. I have mentioned a trade to buy VXX on a bet that the market will reverse and fear will flood back to the market. I think we are getting close to a good risk/reward area to put that trade back on, but I will hold off a bit as I've mentioned before in the comments section, I'd like to see it with a 17 handle. We won't need to go much higher in the market to get to that level.


I hope the attached chart is clear. Click on it to enlarge it, but this is a 3 year picture of the cash S&P 500 (SPX) against the VIX. I have marked each instance where the VIX traded lower than 19. I've also plotted points on the SPX so we could see where it was trading on that same day. (The tabletop line is the spot where showing the value of the SPX rather than the bold dot. The capture software I used moved the dots around, so please use the white line as a graphical indication of where the text values should be). I think the information is pretty compelling that it may make sense to bet that the market will reverse sooner rather than later. Yes, the market can continue higher, but again the VIX is warning us that EVERYONE thinks it is safe in the water, and that is usually when the sharks attack.

Finally, some will say that the last 3 years is not a great sample of to use, but I have two ideas that counter that notion. First, even the most recent correction on January 19th hit a level on the VIX around 17.50 and resulted in nearly a 100 point drop or 8.5% fall in the SPX or a purchase of VXX would have gone from around $27.00 a share to $33.50 in just a few days. So we have recent history that highlights just how actionable this trade can be. Second, the market in the last year has traded in a fashion that is absolutely not normal. The market typically doesn't move in one direction for 10 straight months. Therefore I would suggest that we need to be looking at recent evidence in "this" market rather than long dated historical examples that might not be relevant.


Goatmug

PS - Note the cool little map at the upper right hand portion of the blog. Click on it and it shows a map of where all the visitors to the site are coming from. Thanks for visiting, I think it is neat that someone in Brazil and Indonesia have visited!