Showing posts with label NAR. Show all posts

Monday, March 14, 2011

MARCH MACRO UPDATE - ALL SIGNS POINT TO WHERE?

We've experienced a 3% drop from the highs since February 18th.  While the 3% drop isn't too significant it certainly feels different than trading has felt over the last year or so.  The fundamentals continue to show a mixed to improving economy although the fuel that has propelled the economy over the last several months is schedule to be discontinued by June when QEII will be halted (perhaps).

Over the last month we've seen surging food and commodity prices that have been been the final straw that unleashed riots and discord throughout the middle east and emerging world.  Oil pierced the $100 level and now we must keep in mind the impact that these high costs will have on the fragile economies of the world.  Finally, the Japanese quake and unfolding disaster there will make the world economy more nervous than ever.  

TOTAL RAILS - http://railfax.transmatch.com/
Rails continue to outpace last year's tonnage with the exception of a downturn in grains and food transportation.


RAILS - AUTOS
We have seen an increase in autos that have been shipped in the last week.


RAILS - SCRAP
Scrap shipping continues to be just on pace with last year.


CANADIAN PACIFIC -
CP has recently underperformed last year's shipping totals and that continues to be the case.  In fact, CP's stock price too has been lagging relative to those other rails and has dropped more significantly compared to the likes of KSU or CSX. 


SCRAP INDEX - http://www.scrap.net/cgi-bin/composite_prices.cgi?id=100000&num=5
The Scrap Composite Index showed its first drop since the second quarter of 2010.  It does appear that there is a seasonal component to the drop if you look at the previous year-end, but it is worth watching. 


HOME PRICES - http://www.realtor.org/research/research/ehsdata
NAR reported another drop in the average home price for the month of January to a shocking $206,700. 
The highs in July of 2010 were pegged at $231,700 which highlights the correction we've seen of $25,000!  If you recall the months of June and July were the cutoff dates for the first-time home buyer tax incentives where buyers could get an extra $6,000 to $8,000 towards their home purchase courtesy of the US government (you and me).  What a complete waste!  We are now below the February 2010 lows.  In other words if you were dumb enough to buy a home based on the home buyer credit, you are close to being underwater.


MOODY'S /  MIT TRANSACTION INDEX (COMMERCIAL REAL ESTATE) - http://web.mit.edu/cre/research/credl/tbi.html
The Moody's MIT real transaction index dipped in December by almost 1 percent, although the entire 4th quarter was quite strong.  In total, the rally is not impressive, yet you've got to keep hope alive and any rebound is great.


MONSTER JOB INDEX - http://about-monster.com/employment-index
The Monster.com Job Index rose to a level of 129 in the month of February which is a 7 percent increase over the previous month.  The year over year growth is only 4%, but is positive.  The rebound is needed as it halted a 4 month slide.  The number of listings are well below the September 2010 levels.


FOOD STAMPS (SNAP DATA) - http://www.fns.usda.gov/pd/34SNAPmonthly.htm
December's SNAP (Foodstamps) data release shows up that there is no let up in the amount of Americans that are taking the government up on available programs to feed the poor.  December showed a 1.12% increase over the previous month and now indicates that there were more than 44.1 million people accepting assistance which is a 13.1% increase from the beginning of 2010.  Back in October of 2010 we saw a slowing in the rate of folks on the food stamp roles, however December marks the second straight month of an increasing rate of usage (the rate of change is increasing).  Obviously this information is dated and hopefully the numbers out of the Monster Employment Index can arrest these startling figures.  My heart is breaking for these people.  If you have any desire to see what is happening right here on US soil to your nation's children, please see the post we completed earlier this week - POVERTY IN THE USA - WHAT NO ONE WANTS TO SEE.


CFO OPTIMISM SURVEY - http://www.cfosurvey.org/11q2/PressRelease.pdf
The Duke / CFO Magazine CFO Survey was released last week and it shows that the bean counters in American businesses are more optimistic than last quarter about the economy.  They also suggest that capital spending will increase, and they predict that dividend distributions will actually be much higher.  There were a couple of reasons to pause though as they stated that they don't see much improvement in the job outlook and that any evidence of inflation could damage their outlook.  Hum.  It seems like this is more of the same here.  Company makes more money, company does not hire more employees.  One other note, the firms CFOs stated that credit conditions were improving, except for smaller firms.   


UCLA FUEL INDEX SURVEY - http://www.ceridianindex.com/
Growth in fuel usage has been slowing since January in this index.  This indicator usually follows movements in the overall indices and therefore I do not use it as a predictive tool, but more of a confirmation of overall economic activity.   


COPPOCK TURN INDICATOR
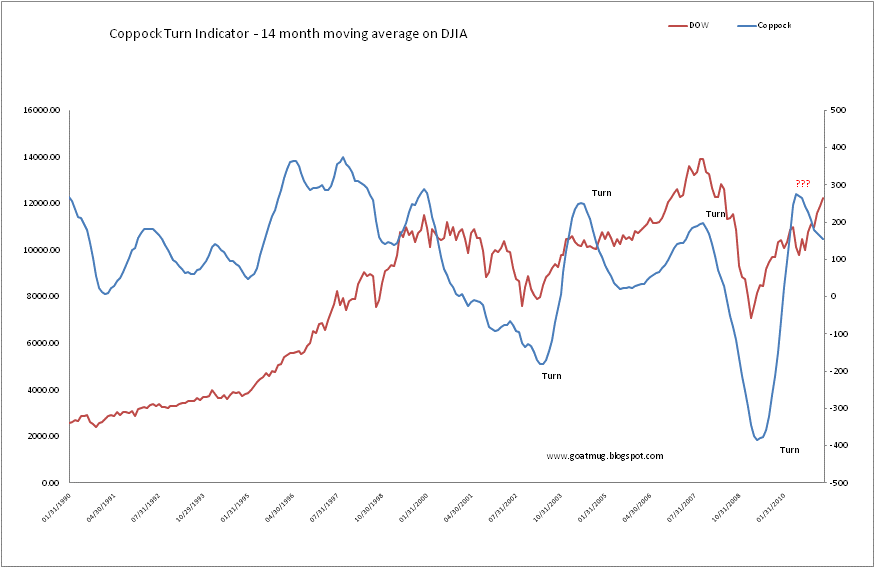
The Coppock Turn Indicator has stubbornly held its negative outlook since it flashed a sell signal all the way back in June of 2010.  If the Dow can move higher than 12125 to close for the month of March it will actually flip to bullish.  As I often comment, I think we've seen that the Coppock is pretty unreliable, but I am keeping it updated for entertainment purposes only.  Perhaps we'll see the Dow at 10500 again soon, but clearly the indicator missed out on a 2000 point ride north since then.
US FINANCIAL CONDITIONS INDEX - http://www.bloomberg.com/apps/quote?ticker=BFCIUS:IND
As we have seen over the last several months, whenever the US Financial Conditions Index eclipses the 0.0 mark it stalls out.  The zero level indicates that the economy is expanding, thus leaving recession behind.  Each time we've seen the FCI hit the 0.5 level it is slammed back and these last several weeks have been no exception.  I perceive this as a warning sign that the economy is still not out of the woods, although perhaps another $600 Billion of QE III might get us up to 1.0 at least, don't you think?  As of Friday the index was back at 0.148.


BALTIC DRY GOODS INDEX - http://www.bloomberg.com/apps/quote?ticker=BDIY:IND
The Baltic Dry Goods Index did see a reversal over the last month and has rebounded strongly.  I am guessing that part of the rebound has been directly related to stockpiling of dry goods such as grains as a result of the unrest in the Middle East.  The timing looks pretty good as an explanation for the significant move up in spot rates.


US DOLLAR - http://www.bloomberg.com/apps/quote?ticker=DXY:IND
Is that a tick up I see?  Strange.  While it is odd to see the dollar move up, I would suggest that this actually could be something we might see continue for a week or two more as this correction in equity markets develops.  We did see the dollar fall on Friday.  The dollar is at a critical place here where it needs to find support.  If not, we could easily see it usher in a new blast lower to areas not previously seen.  The push lower would cause renewed spikes in precious metals and other commodities like copper and oil.


6 MONTH LIBOR -  http://www.homefinance.nl/english/international-interest-rates/euribor-rates-6-months.asp
As we noted earlier last week, 6 Month Libor continues to move higher.  There have been rumors of interest rate hikes in Europe, as a move to stave off inflation, but the weakness in the banking system there simply makes me think that it cannot be done.  We are seeing lots of talk, but little real action.


TRADING UPDATE
In favor of getting this post up for the beginning of the week I am going to cut things a bit short and make every effort to post over the next couple of days a deeper look at specific areas where trading is at a critical juncture. Overall, markets for the last couple of weeks seem to be consolidating and trying to churn through some new selling. The selling hasn't been overwhelming, but heck, it is new to actually see selling! Remember, in our 2011 Forecast we identified March as a critical month due to the idea that big players would not wait to exit markets as QEII terminated. In other words, big funds and hedgies weren't going to wait for June to roll around before exiting positions. If the FED quits buying treasuries then that means that they quit exchanging those treasuries for dollars which somehow find their way into other speculative assets (food and other commodities anyone?). It would not be too hard to believe that we may see a decline in the thrust upward in many of these very frothy "investments" if the fund managers and primary dealers suddenly think that they may lose their source of fuel.
I don't want to get too over zealous though because markets are still weak enough that all it would take to see a huge snap back rally higher is an announcement from Fed officials that weakness is too great to stop these open market actions and QEII will actually be extended with a new batch of electronic cash. I also think that the Japanese disaster is just about enough of an excuse to put all free-market exercises on hold for another 6 months. There will always be a reason to extend an pretend as long as you have a printing press at your fingertips!

Overall, as I mentioned at the top of the post, information is mixed to improving. The overall job picture is getting better, but that doesn't mean that incomes are up. The CFO survey indicates that there are areas where there will be job growth, but as they see it, jobs won't be the big winner in the next quarter. Housing just can't get better and the decline in home prices are really troubling.

I will leave you with this last nugget that I put together with Robert Schiller's Irrational Exuberance data at http://www.irrationalexuberance.com/ . What I'm highlighting here is that we are at P/E levels that have been experienced around 6 other periods in the last 90 years. In each instance, stock markets corrected pretty significantly after those levels were reached. Now this is not to say that the correction is immediate (for goodness sakes, look at the 2000's!), but it is sort of like the treasury trade where we know that we are at historic lows and it is a pretty good bet that we'll see higher rates in the future. In the same manner, we know that we are at high P/E's and there is a safe bet somewhere and at some time that suggests that they will go lower and so will the markets. This is just one more warning that should be going off in our minds that there is risk in this system and we need to be fully aware that things could break down. The obvious question is simply when.


As markets open we should see Japan drop significantly with a carry through of the decline to as much as 10% in coming weeks. There will probably be a rebound due to printing of liquidity. One quick note on oil and other energy fuels, we should also see a drop in oil as there will be a drop in economic activity in Japan and Asia as a result of the disaster. I see this as temporary as the unrest in the Middle East is not going away and I continue to watch for the Saudis to demonstrate and attempt to overthrow their leadership. If any momentum is built in that country, oil and gas will rocket higher.


GOATMUG

Sunday, December 5, 2010

DECEMBER MACRO UPDATE - RALLY ON THE FED'S DIME!

DECEMBER

RAILS - http://railfax.transmatch.com/

Last weeks' rail data continues to show overall strength in rail shipping compared to 2009 and 2008 . There are new "red" levels however that may be signs of slowing, but as usual I'll watch and not get too worried or excited.  Autos do pop out as an issue especially since the volumes are just so poor.  I heard over the last week that at least one of the automakers (GM) was going back to their old games of stuffing tons of inventory on the books of the dealer lots and this was allowing them to make it look like production was strong and sales great.  Think about it, wouldn't you do anything and everything you could to enhance your numbers going into an IPO?  As that surge has hit, perhaps that is a reason for the slowdown in auto shipments.

TOTAL RAILS - (4 WK ROLLING AVG) - http://railfax.transmatch.com/
2010 has been a much stronger year for rail shipping as you can see in the 4 week rolling average comparisons.  We also see that the 4th quarter is one that will lead to a decline in volumes. 
AUTOS - http://railfax.transmatch.com/Perhaps I'm just believing the stuff I hear on CNBC that suggests that everything is better in the world, but I am shocked to see that the auto shipment data below is highlighting an early "cooling" in the auto space.  Obviously there is a seasonal component to this, but it looks to have come a bit early compared to last year (and 2008 too).  


WASTE / SCRAP HAULING - http://railfax.transmatch.com/

No real changes here.  We'll see some data later on in the post that still continues to show scrap prices that are increasing.


(NEW INDICATOR) - PULSE OF COMMERCE INDEX - http://www.ceridianindex.com/
As many of you know I've been wanting to find a good index for tracking of trucking metrics.  I've found one here I believe where much of the work is done for us.  Ceridian in connection with UCLA produces real time data on the pumping of diesel fuel for inter-state commerce trucking.  They put those figures into an index level we can track. 

The key reason that I want to track this metric is that I believe that much of the improvement in rail shipping is a result of a purposeful attempt by truckers to use intermodal shipping to become more efficient.  In the beginning stages of the recovery we heard often that the increase in rail traffic was simply due to the fact that the economy was getting so much better.  I started to doubt this because I was seeing more and more traffic on a rail crossing near my home that contained more and more JB HUNT tractor trailer containers.  Yes, I've seen this before, but not in these volumes. 

My thought was simply that JB HUNT was making smart business decisions to avoid paying drivers and shipping those containers across the country.  This all makes sense as long as fuel costs are high and rail shipping rates are low.  I'll continue to monitor these levels and post them monthly.

Here is the key takeaway.  The October data shows the first 3 month decline in activity since the recession levels of January of 2009.  WE SHOULD NOT BE SEEING A DECLINE IN OCTOBER, IT SHOULD BE THE STRONGEST MONTH OF THE YEAR in anticipation of the holiday retail sales season.  This is an indication that the first quarter industrial productivity and other metrics will be lower than expected!

Finally, while I spend a ton of time looking for these data sources, my friend Carzz at http://blog.rebeltraders.net/ sent me the link and I appreciate it.  If you find an indicator you think is worthwhile, send me an email.


MIT/MOODY'S - http://web.mit.edu/cre/research/credl/rca.html
Property prices in September did rebound on the MIT/Moody's National Transaction Index for Commercial Real Estate.  While I'm very giddy that we continue to maintain a base here, I simply am awestruck by the magnitude of this drop.


NAR AVERAGE HOME PRICE - http://www.realtor.org/research/research/ehsdataExisting home sale prices rebounded a few hundred dollars in the latest report from our friends at NAR showing October prices.  As I've mentioned quite a few times it is so distressing to see how negative the impact the government's program of the housing stimulus was on buyers.  In June and July of this year home prices rocketed up to an average of $230,000 per home as the tax incentives were being doled out.  Now, just a few months later we see that home prices have fallen to right at $219,000 or a shocking $11,000 decline from the artificially high watermark.  So the take away from the entire program is that buyers received $6,000 or $8,000 in "credits" in order to buy a home that was overpriced by at least $10,000 while the taxpayer ultimately provided those "credits".  What a great stimulus.  What a disaster.  And we believe that any ideas to get this economy going by these clowns are going to work?

Clearly the only winners in this debacle were the mortgage companies, banks, realtors, appraisers, and inspectors.  Guess what, these were the same winners from the last round of real estate fraud we just endured in 2003-2007.  We won't learn.
  

MONSTER.COM EMPLOYMENT INDEX - http://about-monster.com/employment-index

The Monster.com Employment Index for November was released and we continue to see a decline in job offerings on the web.  This "leading" indicator should be worrisome as it is a reversal of the employment picture that we need to keep the economy afloat.  The is the second monthly decline since the September high of 138.

WLI - ECRI - http://www.businesscycle.com/resources/
The weekly leading indicators report from ECRI shows a tick up in again as we are in the area of the index at 125 where we were in May of this year.  The WLI is indicating that improvements are coming.


SCRAP METAL COMPOSITE INDEX - http://www.scrap.net/cgi-bin/composite_prices.cgi?id=100000&num=5
Scrap metal continues to make new highs and we should be taking notice.  Our old mentor Alan Greenspan taught us quite a lot about blowing bubbles and this indicator was one of his favorites.  We must also assume that since Mr. Greenspan felt like it was an important indicator, that he must also feel strongly that it's direction must also be up and to the right to signify that there is health in the economic market.  Therefore, Mr. Greenspan and his younger protege Ben Bernanke must be giddy with the conditions they are seeing now (at least without any corrections for the declining value of the dollar).


COPPOCK TURN INDICATOR -
The Coppock 14-month average indicator is still signaling bearish warnings although it has done so for quite a while.  As with every month I warn that this indicator isn't great in the short run.  To give you perspective, the Dow would need to hit 11,900 by December's close for the indicator to actually signal a buy.


BLOOMBERG FINANCIAL CONDITIONS INDEX - http://www.bloomberg.com/apps/quote?ticker=BFCIUS:IND
The Financial Conditions Index again went positive this week as the slosh of liquidity and ever levitating assets in the markets continue their move.  The index's move above 0 reinforces the idea that we are in an expansion phase (not recessionary).  As we have seen all too many times recently the improvement is quite fragile and any shock to the system could put the recovery in doubt as signaled by the BFCI.


BALTIC DRY GOODS SHIPPING INDEX - http://www.bloomberg.com/apps/quote?ticker=BDIY:IND
The spot rate for shipping bulk dry good commodities across the world is back down again.  It would really stink to be a shipper with high amounts of debt, of course there are none of those out there in the world, so carry on!  There were some good things going on with shippers like DRYS as they reported good earnings and that they had locked up shipping rates for almost 80% of their fleet for 2011.  I guess that is good news since the index rates are dropping.


USD - http://www.bloomberg.com/apps/quote?ticker=DXY:IND
The USD Index below shows that the work of the FED has been quite successful since the scare back in May of this year.  Remember in April when we were so worried that a little country like Greece could destroy Europe and the Euro?  Those days seem like forever ago don't they?  With a few clicks of the key board Uncle Ben has printed the USD into the abyss and pushed asset prices up, up, and away.  In November, we had a bit of fear return as a little country named Ireland came into the news.  Concerns over their banks and balance sheets have caused the USD to gain some traction.  Never fear though, all is well in Europe and all it has taken is a few days in December for the USD's plunge to continue.  There is no doubt that there may be a few more countries at risk in Europe, but a steadfast IMF and FED can do anything to bolster our confidence. 


Here's a very quick summary.  We've got the WLI and BFCI moving higher but those are often simply derivative metrics that show the power of liquidity provided by FED.  Trucking and employment are slowing and then we had that interesting employment report on Friday.  Despite the mixed signals, it doesn't matter, as long as USD dives, all other assets rise.  Nothing to see here folks!


DECEMBER TRADING UPDATE -
The FED set the tone last month with the reaffirmation of the QE II strategy.  As bearish as you want to be you cannot avoid the coordinated global efforts of the FED and central bankers to push markets higher.  Whenever there is  a move to adopt some sort of reasonable approach to fiscal responsibility, a crisis like those in Europe seem to raise their heads and force leaders to cow to the religion of more liquidity.  Last month was one of those key months where I felt like I was finally getting back in tune with the market where I was anticipating moves down and feeling strongly that they were opportunities just to add more.  The first few days of December have validated those convictions and my purchases of commodities and emerging markets in the face of these corrections have been rewarded. 

There is no doubt that there are issues in China and other emerging countries as they try to step on the brakes to keep from overheating as inflation is clearly hitting.  Due to this it is important to watch continuously and is the reason that I have not added to my emerging markets positions in November.  In my opinion, the overall trends in the US market and commodities markets are still higher (based on a falling dollar of course) so I'll continue to beat the drum of metals, energy, and commodities.  Remember, we have at least 4 or 5 months more of QE II right? 


While the signs of contagion in Europe have been contained for a day or two we know that this problem is not solved.  I can think of a scenario where we begin to see another crisis in February and March along with an undeniable slowdown in the US from a terrible holiday season.  This is where I am looking to see the correction that has so far been non-existent and long over due.

The headlines and concerns we are reading about the Bush tax-cuts expiration are a story to watch, not because I believe they will not be passed, but in the fact that this story may be the catalyst for another downward move in the markets which will provide yet another opportunity to add to positions or reposition poorly allocated investment dollars.  If Congress does not approve the cuts by 12/31/2010, the incoming House will simply pass a measure and retroactively date them to keep them in place for at least another year or two.  The Obama Administration will hate it, but will sign the measure.

I have two updates on individual positions.

VLO
Take a look at this long-term weekly chart of VLO. The 14 day EMA just crossed over the 40 day EMA (200 day MA). This should be quite bullish. I have no position just yet, but it is compelling. As we see a strong follow through move here over $21 will have me looking for a gain to $24.00.


NFLX
Followers on Twitter noted that I made a call to short NFLX right as the FCC Chairman stated that he supported the idea that distributors of content on the web should or could be made to pay for their consumption of bandwidth on the web and couldn't simply force it down the pipe and consume the infrastructure and resources of the highway providers (ISPs).  Immediately I decided to short NFLX since they provide huge packets of data and flow them downstream to end users without paying for the cost of the highways to folks like AT&T and Comcast. 

The trade was entered at $202.50 and I have a target of $179.00 and $165.00 for exit.  As always, when I have decent gains I begin to get focused on harvesting them.  At $179 I will sell (buy) half of the position back and look for a further drop to the $165 area. 

BE CAREFUL!

GOATMUG