Please examine the story from Reuters here that examines the broker dealer Waddell & Reed as a possible source for the drop in the markets on May 6.
http://www.reuters.com/article/idUSTRE64D42W20100514
The story goes that sometime in the 20 to 30 minutes of nuttiness, Waddell & Reed entered in a trade to sell 75,000 e-mini contracts into the market. The sale had a notional value of close to $4 Billion. Waddell manages several mutual funds and explained that they were employing a hedging strategy for protect their clients. In the text of the story we see some other pieces of data to note.
On average, 50,000 e-mini contracts usually trade in an hour, but in the specific 20 minute period of the fall and rise in the market almost 850,000 e-mini contracts exchanged hands.
Here's the money quote -
"To get rid of 75,000 contracts, that's a lot of trading even if the market is healthy," the trader said. "But when suddenly the market changes and there's not as many bids there to trade with, 75,000 is going to cause quite a shock to the market.
"That's an enormous position for anybody, whether it's a hedge or whether it's a trade. It's a big position, no doubt about it," the trader said."
So again, this story raises more questions than answers and I'm just going to lay them out in no particular order.
1) Where is the mysterious "fat-finger" trade of 16,000,000,000 future trades that CNBC kept referring to?
2) What broker or hedge fund really went bankrupt in that time period. If something happened according to the rumor, someone really blew up.
3) Is it any coincidence that the politicians were examining Fed and bank regulation right at the time of the drop?
4) Who caused the amazing rally that made the markets rise 700 DOW points from the lows?
5) Does anyone really trust this market?
6) When are we going to unplug the computers that are doing HFTs?
GOATMUG
Sunday, May 16, 2010


Tuesday, May 11, 2010
TRADING UPDATE - SLV BREAKING OUT
I'm running around today and don't have much time to post, but wanted to make a brief post. Overall the last couple of weeks have been nuts. The 1000 point drop and subsequent intra-day rally of 700 points followed by a 200 point loss followed by a 400 point gain leave us all wondering what the heck is going on. As a longer term investor it frankly makes me shake my head and want to pull out and wait until the true trend emerges. As many of you know, I believe the true trend is down, we just have the invisible hand of government creating an illusion and delaying what is necessary for this country to be an economic leader.
In the mean-time we see our government has now exported solutions like the TARP to Europe in the form of IMF funding (we are 17% of the IMF) loaning money and making swap lines available to the EU, IMF, and ailing nations. Isn't it great that you didn't have a say in how your money would be frittered away?
As yesterday's announcement was made the EURO seemed to come alive and vaulted higher on the news that Greece and other ailing nations would be bailed out. The ECB and IMF will directly support (buy) bonds of these bankrupt nations and prevent them from falling in price (sound familiar?- the US says that it just stopped doing that but we know that Japan is now doing it as well). By buying the bonds in the open market it distorts the real price of bonds so it hides the real or appropriate cost of the risk, and also allows the ailing country to continue to roll its expiring debt. So, essentially the ECB and IMF basically are allowing the lies that European nations are actually worthy to lend money to --- to go on. And of course, we're lending them more money when borrowed money is actually the problem.
There was only one problem with how things worked out yesterday. The EURO fell apart at the end of the day and ended exactly the same way it had at the beginning. Essentially traders didn't buy the whole buyout and bailout and think that this doesn't do anything but buy these countries a few more months or a year. Traders are putting their money down shorting the Euro. Rumors are being posted that the banks in Europe are actually shorting the Euro too! Isn't that great, we're essentially bailing them out by buying sovereign debt of countries (which they hold on their balance sheets) and they are shorting the Euro knowing that it will continue to fall. The act of shorting continues the problem and continues to make it fall!
So to summarize, the bailout added more debt as a solution for too much debt. The US taxpayer has no say in giving away money that is doomed not to be repaid and the bankers in Europe are going to make money on failing as they bet that they will fail!
Gold and silver are tipping us off too that the market believes this is either going to be a collapse where metals will be the only thing worth anything or they are betting that this is inflationary and the metals are going to go up as inflation kicks in. Here is a chart I'm watching on SLV. I hate buying anything when it it is near highs, but it is clearly breaking out to the upside.
No matter what, I think we will rise, but again, I'm leaning toward the idea that we retest 10250 again on the DOW. I'll put up some charts and show why I believe that, but no matter what, I'm going to bet that many Joe 6-Packs just take their money out of the market and let the computers eat each other alive. This market is insane and not based on fundamentals, just market moving stories strung together, which is hard to trade.

In the mean-time we see our government has now exported solutions like the TARP to Europe in the form of IMF funding (we are 17% of the IMF) loaning money and making swap lines available to the EU, IMF, and ailing nations. Isn't it great that you didn't have a say in how your money would be frittered away?
As yesterday's announcement was made the EURO seemed to come alive and vaulted higher on the news that Greece and other ailing nations would be bailed out. The ECB and IMF will directly support (buy) bonds of these bankrupt nations and prevent them from falling in price (sound familiar?- the US says that it just stopped doing that but we know that Japan is now doing it as well). By buying the bonds in the open market it distorts the real price of bonds so it hides the real or appropriate cost of the risk, and also allows the ailing country to continue to roll its expiring debt. So, essentially the ECB and IMF basically are allowing the lies that European nations are actually worthy to lend money to --- to go on. And of course, we're lending them more money when borrowed money is actually the problem.
There was only one problem with how things worked out yesterday. The EURO fell apart at the end of the day and ended exactly the same way it had at the beginning. Essentially traders didn't buy the whole buyout and bailout and think that this doesn't do anything but buy these countries a few more months or a year. Traders are putting their money down shorting the Euro. Rumors are being posted that the banks in Europe are actually shorting the Euro too! Isn't that great, we're essentially bailing them out by buying sovereign debt of countries (which they hold on their balance sheets) and they are shorting the Euro knowing that it will continue to fall. The act of shorting continues the problem and continues to make it fall!
So to summarize, the bailout added more debt as a solution for too much debt. The US taxpayer has no say in giving away money that is doomed not to be repaid and the bankers in Europe are going to make money on failing as they bet that they will fail!
Gold and silver are tipping us off too that the market believes this is either going to be a collapse where metals will be the only thing worth anything or they are betting that this is inflationary and the metals are going to go up as inflation kicks in. Here is a chart I'm watching on SLV. I hate buying anything when it it is near highs, but it is clearly breaking out to the upside.
No matter what, I think we will rise, but again, I'm leaning toward the idea that we retest 10250 again on the DOW. I'll put up some charts and show why I believe that, but no matter what, I'm going to bet that many Joe 6-Packs just take their money out of the market and let the computers eat each other alive. This market is insane and not based on fundamentals, just market moving stories strung together, which is hard to trade.

GOATMUG
Monday, May 10, 2010
US FOODSTAMP PROGRAM - 40,000,000 IN MAY
I mentioned in yesterday's update that I was also working on some other items. I'll keep them coming now that I've learned how to write a macro in VB to save excel graphs as a gif. I can't tell you how long it has taken me to get this done (it was simple, I just needed to Google it rather than struggle over and over again!).
Anyway, here is a graphic of the number of folks on the SNAP program or those taking foodstamps. The number of people as of May taking foodstamps is almost 40 million. The annual projected cost for feeding them at $200 a month is above $5,000,000.
Projections for 2011 suggest that the number of people taking foodstamps will be 43 million. Why isn't the USDA projecting the number will go down?

Anyway, here is a graphic of the number of folks on the SNAP program or those taking foodstamps. The number of people as of May taking foodstamps is almost 40 million. The annual projected cost for feeding them at $200 a month is above $5,000,000.
Projections for 2011 suggest that the number of people taking foodstamps will be 43 million. Why isn't the USDA projecting the number will go down?

Goatmug
Sunday, May 9, 2010
MAY UPDATE - FUNDAMENTALS GAINING / RECOVERY WATCH?
RAIL TRAFFIC -
Total rail traffic continues to show increases YoY, however we must continue to look at previous levels from 2008 and note that we are still 50,000 tones away from peak levels. We are taking note that the increase continues.


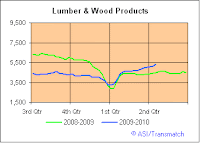
Crushed Stone and Lumber continue to tick up which indicates some growth in commercial real estate development. Lumber doesn't get me too excited, but the rate of growth on the trend line of crushed stone is saying that we need to look for new project starts. This may also be a flow through of some of those Obama "shovel" ready projects that weren't so ready. Perhaps those road construction projects are getting going.
KSU - KSU was bloodied tremendously during the correction. In fact in the midst of the correction, several banks downgraded some other rails too. KSU dropped from over $41.00 to $36 in the last several days. The firm reported great earnings and management also released good forward guidance. The knock on it was that they just issued stock to take out high cost debt. I will post a chart if it looks good for an entry.
WLI DATA FROM ERCI -
The stimulus plan to get homes moving did create results as first time home buyers and trade up buyers got off their tails and entered into contracts to buy homes. The answer we'll be watching for will be whether or not it will last. The timing is pretty good in the sense that the summer moving season is here, so the next 2 months will be critical.
HOME PRICES -
Home prices continue to move up per the leading home price index, but the measure of real home price is showing no change in its downward move. The leveling off of this index does give us a sense that perhaps the leading index could be telling the truth, but we'll have to wait and see. I personally believe we have a couple of issues with the leading index that will make this thing turn back down.
First, we have the absence of the Fed's intervention in the MBS market. As they have said they will stop agency purchases, we will have a move up in interest rates, UNLESS we have a flight to safety and all of a sudden other asset classes are perceived to be much riskier (ANY COINCIDENCE?).
Second, the termination of the stimulus plan will make those buyers that were "stimulated" get deals done. In other words, these were probably all buyers that would have bought in the next 6 months anyway. I agree totally with the pull forward of demand theory that suggests that this program just moved the timeline up a bit to take advantage of the taxpayer's open wallet.
Third, I don't think we've seen an end to the tidal wave of foreclosures that banks are going to release. I don't think that the release of the inventory has been captured in the leading indicators data.
Fourth, the mortgage loan guarantors are broke and filled to the gills in horribly defaulted loans. At some point someone sane will stop the madness and really tighten up mortgage lending standards.


WLI Data Leading Indicators are showing a complete reversal in the very short term. We'll need to watch it to see what happens next week.
FCI - FINANCIAL CONDITIONS INDEX -http://www.bloomberg.com/apps/quote?ticker=BFCIUS:IND
CAN YOU SAY WOW!?? I've been watching this indicator every single day for the last week. As you know, this is a quick measure of 7 or 8 pieces of data that give us an idea if we are in recession or expansion. For the last 14 months the FCI has moved from the abyss to expansion. As I've reported often, the FCI data is subject to the manipulation errrr the momentum delivered by all sorts of Fed related activities. So therefore attempts to increase liquidity tend to bump up the FCI. It only took one week to shatter the great work that has been going on in the FCI. The FCI now is well below zero (although it could easily come back up with a string of good days). I mention this simply because I felt pretty strongly that we'd have a double dip, but the speed of the reversal shown here certainly is surprising. The first picture is from Tuesday. The second snapshot is one that shows the level of the FCI at -.77 on Sunday May 9th.


USD - http://www.bloomberg.com/apps/quote?ticker=DXY%3AIND
The USD caught a bid over the last several days as fear gripped the world and great buys like Greek debt seems not so great. When real fear sets in the US treasury bond is really king and in those times, they need to convert their currencies into dollars making the currency go up in comparison to a basket of other currencies of the world. This also makes yields on treasuries drop too as the prices of the US debt does higher. As of Sunday night, we're seeing the dollar off a bit here because the EU is stepping in an offering a plan to "protect the EURO" and stating they are going to commit $962 billion Euros to provide economic stability. So they would have you believe that they have made all the worries go away and everything is all better....... until Spain and Portugal and Italy need bailing out.
I'm not sure how providing another 1 Trillion euros worth of loans provided by equally bankrupt countries will help much but go ahead and pass the kool-aid, it's starting to get hot here and at least it might provide a week or two of liquid confidence to the market.

BALTIC DRY GOODS INDEX - http://www.bloomberg.com/apps/quote?ticker=BDIY%3AIND

JOBS DATA -
Non farm payroll data showed that employment INCREASED 290,000 jobs last week. The positive report shows that employers are adding people. There are also folks that were discouraged and not looking that are now back at it. This will actually lead to a higher unemployment rate as the BLS folks must count people that are actively searching. It is very interesting that as people drop off of unemployment benefits they magically find jobs! Don't get me wrong, there are extremely tough circumstances out there and there are legitimate folks that cannot find work. On the other hand there are other folks that can find work that don't because they have access to some income and as a result aren't looking. No matter what, this is the third month of gains and we need to be looking at it.
GDP -
GDP was reported at the end of the month and it came in at a +3.2%. This was down from the previous quarter's number of +5.6%, but it is still positive.
FUNDAMENTALS - WHAT'S IT ALL MEAN?
Well, I've strung together a bunch of stuff that indicates that things are getting better. The reason why I document these things is that if you read in my tone that I'm bearish, I write it and post it so that I can be challenged by the real numbers. So, the data including GDP, Home Prices, Jobs, and Rail Traffic all look like they are not only turning the corner, but have posted several periods of strong numbers. The bear in me wants to point out that the rate of change of improvement is slowing for almost all of these items, so we need to keep watching. This of course would dovetail exactly with my idea that we'll have a double dip recession in the economy. In addition, although the consumer seems to be back to his old ways, I'm still betting that much of the economy's recovery has been on the back of an inventory build of depleted merchandise and materials as manufacturers need to restock since they simply halted inventory replacement orders during the really tough and scary times of 2008 and 2009. Now that all of that inventory was run down to nothing, they had to get ordering and manufacturing. Once all the factories and companies are restocked, we'll need to rely on real demand to provide economic growth. My bet is that that growth isn't there.
Last week will be all that the consumer needs to see that the stock market really hasn't recovered and is just as unstable as it was in 2008. Remember, we've noted all too many times that the FED and government KNOW that the STOCK MARKET is economy. What I mean by this is simply that the stock market previously was an indicator of health in the market, rather now, the stock market is the driver of "health or perceived health" in the economy. This makes it so much simpler to know what to do to kick the economy into gear doesn't it. If the market drives the economy, the strategy is to goose the market to goose the economy. And guess what? This is exactly why in March of 2009 that the government outlawed short selling and started buying stocks through the large primary dealer banks. We've seen consumer confidence rise and the stock market has risen. What will happen to that same consumer confidence if the market volatility of the last week stays and we suffer several more serious setbacks? My guess is that the US consumer that has previously driven 70% of our economy, will suddenly go back on strike and remain conservative. Perhaps it isn't such a bad thing that they return to frugality.
Anyway, I continue to watch the fundamental recovery, but almost every fiber in me desires to see the linkage of each data point to the government hand that is pushing it. When the government doesn't or can't keep pushing it, will the recovery halt as well?
I've got a couple of other items to post and I'll do those plus add a trading update in tomorrow's posts. The infamous 1000 point plunge is extremely concerning and normal trade action indicates that we'll probably see that same 10,000 level on the DOW again simply to retest it. I keep hearing that everyone wants to find out how we had this avalanche downward. I personally want to know how we had the rise upward to recover. Many professional traders have their finger on the trigger as they have thought this was a fake rally for the last 2000 points on the DOW. So did everyone of those guys see that the market was tumbling and hit the sell button? Do you really believe that some hapless trader fat-fingered a trade and entered in an order to sell 16 billion S & P futures? REALLY? Where is the P& L hit then? If that happened, a hedge fund or bank would have gone bankrupt instantly and at least we would have heard that someone got fired.
That drop was real and it was panic. I'm not so sure that the surge was real though. At least real in the sense that it was inspired by average Joe buying stocks to take advantage of the drop. It certainly was Fed inspired, I'd bet.
Goatmug
Total rail traffic continues to show increases YoY, however we must continue to look at previous levels from 2008 and note that we are still 50,000 tones away from peak levels. We are taking note that the increase continues.


Crushed Stone and Lumber continue to tick up which indicates some growth in commercial real estate development. Lumber doesn't get me too excited, but the rate of growth on the trend line of crushed stone is saying that we need to look for new project starts. This may also be a flow through of some of those Obama "shovel" ready projects that weren't so ready. Perhaps those road construction projects are getting going.
KSU - KSU was bloodied tremendously during the correction. In fact in the midst of the correction, several banks downgraded some other rails too. KSU dropped from over $41.00 to $36 in the last several days. The firm reported great earnings and management also released good forward guidance. The knock on it was that they just issued stock to take out high cost debt. I will post a chart if it looks good for an entry.
WLI DATA FROM ERCI -
The stimulus plan to get homes moving did create results as first time home buyers and trade up buyers got off their tails and entered into contracts to buy homes. The answer we'll be watching for will be whether or not it will last. The timing is pretty good in the sense that the summer moving season is here, so the next 2 months will be critical.
HOME PRICES -
Home prices continue to move up per the leading home price index, but the measure of real home price is showing no change in its downward move. The leveling off of this index does give us a sense that perhaps the leading index could be telling the truth, but we'll have to wait and see. I personally believe we have a couple of issues with the leading index that will make this thing turn back down.
First, we have the absence of the Fed's intervention in the MBS market. As they have said they will stop agency purchases, we will have a move up in interest rates, UNLESS we have a flight to safety and all of a sudden other asset classes are perceived to be much riskier (ANY COINCIDENCE?).
Second, the termination of the stimulus plan will make those buyers that were "stimulated" get deals done. In other words, these were probably all buyers that would have bought in the next 6 months anyway. I agree totally with the pull forward of demand theory that suggests that this program just moved the timeline up a bit to take advantage of the taxpayer's open wallet.
Third, I don't think we've seen an end to the tidal wave of foreclosures that banks are going to release. I don't think that the release of the inventory has been captured in the leading indicators data.
Fourth, the mortgage loan guarantors are broke and filled to the gills in horribly defaulted loans. At some point someone sane will stop the madness and really tighten up mortgage lending standards.


FCI - FINANCIAL CONDITIONS INDEX -http://www.bloomberg.com/apps/quote?ticker=BFCIUS:IND
CAN YOU SAY WOW!?? I've been watching this indicator every single day for the last week. As you know, this is a quick measure of 7 or 8 pieces of data that give us an idea if we are in recession or expansion. For the last 14 months the FCI has moved from the abyss to expansion. As I've reported often, the FCI data is subject to the manipulation errrr the momentum delivered by all sorts of Fed related activities. So therefore attempts to increase liquidity tend to bump up the FCI. It only took one week to shatter the great work that has been going on in the FCI. The FCI now is well below zero (although it could easily come back up with a string of good days). I mention this simply because I felt pretty strongly that we'd have a double dip, but the speed of the reversal shown here certainly is surprising. The first picture is from Tuesday. The second snapshot is one that shows the level of the FCI at -.77 on Sunday May 9th.


USD - http://www.bloomberg.com/apps/quote?ticker=DXY%3AIND
The USD caught a bid over the last several days as fear gripped the world and great buys like Greek debt seems not so great. When real fear sets in the US treasury bond is really king and in those times, they need to convert their currencies into dollars making the currency go up in comparison to a basket of other currencies of the world. This also makes yields on treasuries drop too as the prices of the US debt does higher. As of Sunday night, we're seeing the dollar off a bit here because the EU is stepping in an offering a plan to "protect the EURO" and stating they are going to commit $962 billion Euros to provide economic stability. So they would have you believe that they have made all the worries go away and everything is all better....... until Spain and Portugal and Italy need bailing out.
I'm not sure how providing another 1 Trillion euros worth of loans provided by equally bankrupt countries will help much but go ahead and pass the kool-aid, it's starting to get hot here and at least it might provide a week or two of liquid confidence to the market.

BALTIC DRY GOODS INDEX - http://www.bloomberg.com/apps/quote?ticker=BDIY%3AIND
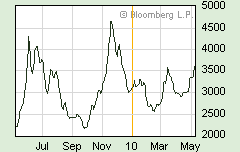
While the markets and commodities were getting shelled over the last week, something odd was happening to the Baltic Dry Goods Index. Remember, this is the spot price for getting a ship to move your dry commodities around at the last minute. Note the move higher. We've been looking for higher highs and higher lows to indicate that the demand for commodities is real. Just watching, but in the midst of such a sell off you might expect to see some paralysis in the spot shipping rates too. It didn't happen last week, even though many of the shippers like DRYS got hammered. I'm showing that the index is now at 3608 as of Sunday night. Obviously higher than that last peak in late March.
JOBS DATA -
Non farm payroll data showed that employment INCREASED 290,000 jobs last week. The positive report shows that employers are adding people. There are also folks that were discouraged and not looking that are now back at it. This will actually lead to a higher unemployment rate as the BLS folks must count people that are actively searching. It is very interesting that as people drop off of unemployment benefits they magically find jobs! Don't get me wrong, there are extremely tough circumstances out there and there are legitimate folks that cannot find work. On the other hand there are other folks that can find work that don't because they have access to some income and as a result aren't looking. No matter what, this is the third month of gains and we need to be looking at it.
GDP -
GDP was reported at the end of the month and it came in at a +3.2%. This was down from the previous quarter's number of +5.6%, but it is still positive.
FUNDAMENTALS - WHAT'S IT ALL MEAN?
Well, I've strung together a bunch of stuff that indicates that things are getting better. The reason why I document these things is that if you read in my tone that I'm bearish, I write it and post it so that I can be challenged by the real numbers. So, the data including GDP, Home Prices, Jobs, and Rail Traffic all look like they are not only turning the corner, but have posted several periods of strong numbers. The bear in me wants to point out that the rate of change of improvement is slowing for almost all of these items, so we need to keep watching. This of course would dovetail exactly with my idea that we'll have a double dip recession in the economy. In addition, although the consumer seems to be back to his old ways, I'm still betting that much of the economy's recovery has been on the back of an inventory build of depleted merchandise and materials as manufacturers need to restock since they simply halted inventory replacement orders during the really tough and scary times of 2008 and 2009. Now that all of that inventory was run down to nothing, they had to get ordering and manufacturing. Once all the factories and companies are restocked, we'll need to rely on real demand to provide economic growth. My bet is that that growth isn't there.
Last week will be all that the consumer needs to see that the stock market really hasn't recovered and is just as unstable as it was in 2008. Remember, we've noted all too many times that the FED and government KNOW that the STOCK MARKET is economy. What I mean by this is simply that the stock market previously was an indicator of health in the market, rather now, the stock market is the driver of "health or perceived health" in the economy. This makes it so much simpler to know what to do to kick the economy into gear doesn't it. If the market drives the economy, the strategy is to goose the market to goose the economy. And guess what? This is exactly why in March of 2009 that the government outlawed short selling and started buying stocks through the large primary dealer banks. We've seen consumer confidence rise and the stock market has risen. What will happen to that same consumer confidence if the market volatility of the last week stays and we suffer several more serious setbacks? My guess is that the US consumer that has previously driven 70% of our economy, will suddenly go back on strike and remain conservative. Perhaps it isn't such a bad thing that they return to frugality.
Anyway, I continue to watch the fundamental recovery, but almost every fiber in me desires to see the linkage of each data point to the government hand that is pushing it. When the government doesn't or can't keep pushing it, will the recovery halt as well?
I've got a couple of other items to post and I'll do those plus add a trading update in tomorrow's posts. The infamous 1000 point plunge is extremely concerning and normal trade action indicates that we'll probably see that same 10,000 level on the DOW again simply to retest it. I keep hearing that everyone wants to find out how we had this avalanche downward. I personally want to know how we had the rise upward to recover. Many professional traders have their finger on the trigger as they have thought this was a fake rally for the last 2000 points on the DOW. So did everyone of those guys see that the market was tumbling and hit the sell button? Do you really believe that some hapless trader fat-fingered a trade and entered in an order to sell 16 billion S & P futures? REALLY? Where is the P& L hit then? If that happened, a hedge fund or bank would have gone bankrupt instantly and at least we would have heard that someone got fired.
That drop was real and it was panic. I'm not so sure that the surge was real though. At least real in the sense that it was inspired by average Joe buying stocks to take advantage of the drop. It certainly was Fed inspired, I'd bet.
Goatmug
Thursday, May 6, 2010
SPX & TOMMOROW'S VOTE
SPX is down again today, all on the fear that this European debt issue has real consequences for the world recovery. European parliments are voting over the next day whether or not to extend more credit and bailout Greece. In my opinion all of this is absolutely necessary to continue the game of pretending all of these countries and banks are solvent. What choice to the finanical elites have but to keep it going?
So, if Germany does not go along with the charade, expect nastiness. If Germany does, expect a pop to the upside.
I've attached a chart of the SPX so you can see the major support lines - this is a close up of a 700 week chart. Below the chart I will note the support levels and upper resistance levels.
RIGHT NOW THE SPX is trading at 1159, remember this is a weekly chart so it shows a data point last week near 1200.

1136
1086
1055
Upper Resistance (if we get moving back up in celebration) -
1216
1176
1161
Subscribe to:
Posts (Atom)

 Posts
Posts


