Wednesday, February 9, 2011

FEBRUARY MACRO UPDATE - RECOVERY IN ASSET PRICE ONLY?

RAILS - http://railfax.transmatch.com/
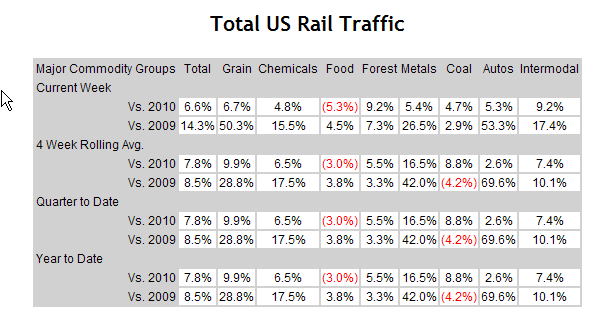
Rails continue their march higher in terms of their increases in shipments compared to 2010 and 2009, with the exception of food.  Interesting decrease here, but as with all economic statistics that underperform we'll just blame the weather.  I recall my days as a Financial Analyst doing budgets for a big company where I simply used "timing differences" as my excuse for variances I simply had no idea why they were off.  I think "weather" is just like a timing difference.
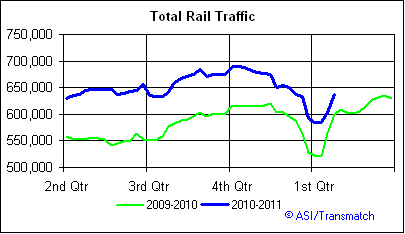
TOTAL RAILS
We saw a season dip over the last month and now we are back into the ramp up stage.  It is important to have seen that we didn't cross below the 2010 levels here.
AUTOS
Motor vehicle shipments continue to be of concern as we just are increasing the shipments like we should given the super recovery that we have been promised.  Ford's disappointing report over the last week was essentially tipped by watching the rail shipping data below.  It won't be hard to imagine that GM comes out with numbers that are quite as good either.  Have you noticed that GM hasn't been able to exceed that $39 mark we highlighted several weeks ago?


RAILS / SCRAP TONNAGE
Scrap shipments continue to go along the trend line from last year.  Essentially the data here, with autos, and a few other items we'll review shows that this is a "recovery-less recovery" (yes, Goatmug owns the trademark on that!).


KSU - I've captured a few snapshots of individual rail tonnage for you.  All seem pretty similar, but the hope is to find the weak one of the bunch.  Let's see if we can find it.


NORFOLK SOUTHERN -
Looks actually a bit better than KSU.


CANADIAN PACIFIC - Uh oh, one of these pledges is not like the others.  (Remember, stock performance is all about expectations.  I would contend that that dip below 2010 levels may not be a positive.  I have looked at CP's chart though and it is pretty impressive.)


SCRAP COMPOSITE PRICE INDEX -
http://www.scrap.net/cgi-bin/composite_prices.cgi?id=100000&num=5
Scrap prices were Alan Greenspan's favorite macro-indicator, but I'm wondering if all macro-indicators are worthless in this asset price melt up and dollar meltdown environment.  This beautiful chart just continues to go up and to the right.


AVERAGE PRICE - HOME SALES - http://www.realtor.org/research/research/ehsdata
December home prices were released and we continue to see real estate decline.  The effects of QE II have just begun to impact mortgage rates (in this data) and we can only assume that the home price slide will accelerate.


ARCHITECTURE BILLINGS INDEX - http://www.aia.org/practicing/economics/AIAS076265
In my quest to add more indicators, my buddy Carrz suggested that we should use the Architecture Index.  Billings and Inquires are up based on their December survey.


MOODY'S / MIT TRANSACTION INDEX - http://web.mit.edu/cre/research/credl/rca.html
The Moody's / MIT Transaction Index recorded another rise of .6% for the month of November (released last week of Jan).  Commercial real estate has been very solid here and has not declined further.  Has the the bottom been made and are we in the clear?


MONSTER.COM INDEX -  http://about-monster.com/employment/index/15
While real estate prices may be going higher, job prospects seem to be not getting better.  In fact, the Monster.com job listing index has recorded another monthly decline.  Essentially Monster.com records the number of online job listings that are available.  This is the fourth straight drop in this data.  Are all the positions taken?  Monster tried to spin this and state that this is a 7% increase from the previous year's level, but I don't see it that way.  January of 2010 was the edge of the cliff, are we really expecting to be way over this level?


FOOD STAMPS - SNAP DATA - http://www.fns.usda.gov/pd/34SNAPmonthly.htm
Below is a graphic of the most recent food stamp data.  Almost 43.6 million, ok let's be exact 43,595,000 are obtaining food stamps at a cost of $5.8 billion!  Essentially each person is receiving $133 a month in government food assistance.


UCLA / CERIDIAN FUEL INDEX - http://www.ceridianindex.com/
January's release of the PCI shows a slight decline from December's big gains.  Ultimately this can probably be blamed on weather if you can believe it (and I actually do believe it for this stat!).


COPPOCK TURN INDICATOR


6 MONTH EURIBOR -
http://www.homefinance.nl/english/international-interest-rates/euribor-rates-6-months.asp
Interbank lending rates continue to climb.  We haven't heard much about Europe over the last couple of days, but we should keep Greece in mind and not be eased into any complacency.  It is coming, it is just a matter of when, rather than if.


US FINANCIAL CONDITIONS INDEX -
http://www.bloomberg.com/apps/quote?ticker=BFCIUS:IND
The US Financial Conditions Index not is solidly above zero which indicates that the economy is expanding.


BALTIC DRY GOODS INDEX -
http://www.bloomberg.com/apps/quote?ticker=BDIY&exch=IND&x=15&y=11
The Baltic Dry Goods Index continues its free fall.  Spot shipping rates are simply off the cliff and it is anyone's guess as to when the drop will abate.


USD - http://www.bloomberg.com/apps/quote?ticker=DXY:IND
The USD Index is captured below.  One might expect a defense of these levels here,. but one might expect alot of things in this economy that don't happen.  If we do see some strength in the dollar, we would expect to see the commodities complex sell off and perhaps the equity market too.  If we see more declines in the dollar index, we should see Garth and Ben out yelling "Party On Wayne!"


CORN -
Commodities like the softs (corn, wheat, etc) continue to rock.  Take a look at the graph for corn and note that we are right back at the levels of the summer of 2008 where President Bush happily signed the corn/ethanol subsidy bill and made life hard for Mexican families that choose to consume corn tortillas.  Isn't it great that we still subsidize corn based ethanol despite the fact that it is terribly wasteful and inefficient!  Wouldn't that corn be better placed in the stomachs of people rather than the fuel tanks of autos?


COMMODITIES SNAPSHOT -
Here is a neat snapshot of all of the commodities for the last 1 year period.  As Ben Bernanke testified today, there is no inflation, but they are watching the increase in commodity prices closely.  Hopefully they are watching those price levels rather than the same screens as the folks at the SEC. http://abcnews.go.com/GMA/sec-pornography-employees-spent-hours-surfing-porn-sites/story?id=10452544  (Remember this awesome revelation from April 2010?)


TRADING UPDATE
I want to wrap up and I'm forced to take a deep sigh.  We really have a mixed bag still where some portions of the economy look have begun their recovery and other parts are simply mired in a funk. 

Rail shipping looks to be improving or at least remaining at higher levels.
Commercial real estate seems poised to move higher.
Employment could go either way, but I'm leaning to the side of a slowing of hiring as opportunities are gone (filled or simply the job was removed).
Housing stinks and is essentially a lost asset at this point, especially with the specter of higher interest rates.
Commodities will soon hit the level where they inhibit any recovery in the global economy so I think there is limited upside.
Credit concerns have not abated and we are seeing discussions of haircuts in Greece and CDS blowing out to all time highs for Portugal.

With all of these negatives and a few positives it is just amazing to me to see many of the indices trading at or near July 2007 highs (and near almost all-time highs of Oct 2007).  I've struggled with how to characterize this economic and stock price move and I think the best way to capture it is to say that this has been a "RECOVERY IN ASSET PRICE ONLY".  In other words, the economy comeback we've seen is only in the levels of stock indices rather than in the basic fundamentals in the real economy.

Emerging markets continue to be of great concern for me thus today's FXI update and I still remain bullish on energy here as described in the 2011 outlook.  We have made it through January without the correction that I've been looking for, I don't know if it is merely delayed or just not coming.  My thesis that we'll see strength domestically through the first 4 or 5 months of the year still looks good but that is no reason to not remain vigilant.

GOATMUG


CHINA - LOVEABLE PANDA OR BLOOD SUCKING GRIZZLY BEAR (PART II)

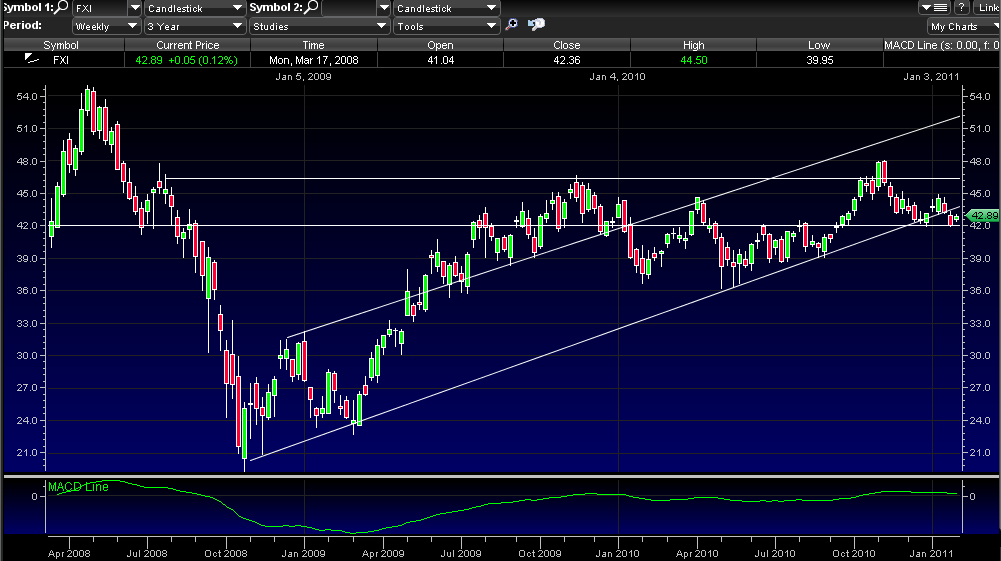
Just a quick follow up on the China trade (FXI) I outlined last week. In the post titled, China - Great Big Loveable Panda or Blood Thirsty Bear I noted that the etf was close to breaking critical support at $42.00. As often is the case, I have been short that trade since the post and have slowly been bled to death by the daily POMO that makes markets go one direction despite the fundamentals that suggest the price action should be the opposite.


As of this writing at 9AM Eastern, FXI is trading at $41.79 pre-market. If we open here, this should be cause for a doubling of my short position, with a target on the downside of at least $39.00 and a lower target of $36.00
China raised one year interest rates yesterday by a quarter of a point to 6.06% as they attempt to cool off their overheating economy. Please see the following Bloomberg article on the topic - http://www.bloomberg.com/news/2011-02-09/hong-kong-gauge-drops-to-lowest-this-year-as-china-raises-rates.html
(FXI)

What does this mean for other emerging countries? The serious answer is I don't know. If we look at charts like EEM, I don't see anything there that is a big tell as to direction, although it is really just floating out in space and could easily drop back to support around $43.75. I think a better target might be found in a chart like the one below EWS (Singapore), it looks like a pretty good short with an easy stop above $14.00.
(EWS)


I will have the monthly macro update done this evening. Please continue to check in at http://www.goatmug.blogspot.com/ . Until then, be careful!


GOATMUG

Friday, February 4, 2011

MORE JOBS OR MORE QUESTIONS - BLS DATA OR JUST BS?

Apparently I wasn't the only one that thought the "jobs" report was a little suspect. Please enjoy this video from David Stockman the former Director of the OMB.  He is a regular on CNBC and he completely discounts much of the improvement in the economy and employment.  Fast forward to around 3:00 in the interview.  It is well worth your time.

Specifically, he points out that we are not adding enough jobs to keep up with population growth AND we have less employed folks working than when the recession ended.


Stockman calls into question the use of QE and the remarks that the FED is responsible for all the commodity inflation.  David calls for some sanity in the markets and really suggests that we are in some deep trouble ("and it won't be in 3 years").


GOATMUG

JOBS - 16.1% UNEMPLOYMENT?

I think Rick Santelli from CNBC has an entertaining rant about the jobs report.  Enjoy.

As of 1:13 today the Dow is now up, isn't it great to invest in a market where securities never go down?


GOATMUG

Wednesday, February 2, 2011

CHINA - GREAT BIG LOVEABLE PANDA OR BLOOD THIRSTY BEAR?

Lately I've been doing more writing and have been highlighting the battle that is being waged in the economy.  In my recent article Inflation Bombs, I discussed how the US central bank was using dollar devaluation to inflate assets (stocks and commodities).  The next major post highlighted the Japanese experience with deflation in Why Aren't We Turning Japanese
The key takeaway in these posts is that our US FED has opted to inflate assets and the by-product of that choice is a flood of speculative dollars deployed throughout the world.  The result of the deluge has been massive increases in commodity prices, tougher living conditions for the poor and retired, and an increase cost of living for US and world citizens. 

I received a few comments from a reader the other day and the basic thrust of his comments were that China and the emerging economies were an easy choice for us to make when compared to the recessionary economy of the US.  While there is part of me that agrees with him fully we need to make a distinction between "economy" and stock or commodity investing targets (of course time frame is important too).  My statement is made clear as we examine the chart below and see that the FXI has dropped some 11% from it's recent highs in November. 


FUNDAMENTAL VIEW
From a fundamental long term perspective I think the reader has the correct investment thesis (of course I like it because I've had it and traded on it for the last 18 months!).  However, the short-term in China has me taking a pause because the charts are telling me that we are at an inflection point.  We'll talk about those technical trading markers in a second.  First though, I'll put China in the same basket as all the other emergings that I like. 

POSITIVES
Relative Low Employment Costs (to Europe or the US)
Little Environmental Protection Regulation
Excellent Demographics (Growing Middle Class)
Fast Growing Economy

NEGATIVESQuestionable Rule of Law (Legal Rights and Copy-Right enforcement)
Closed markets to foreign firms
Inflation (Wages)
Inflation (Land)
Inflation (Raw Materials)
Inflation (Food)

If you are getting the point that I'm most concerned about inflation in the emerging world, you'd be right.  We don't need to look further than Tunisia, Egypt, Jordan, Yemen and Oman to see that poor, unemployed, youth ultimately rise up and look to change the leadership and rules of the land.  The food inflation and poor employment may have been the final straw that broke that cause the Tunisians and Egyptians to revolt, but these are real issues that we must examine in our favorite countries like Singapore, Malaysia, South Korea, Taiwan, Thailand, Chile, India, and Indonesia.  To clarify, I tend to think that China is further along in its emergence than the others that I've listed, and in fact is now had such an improvement that it is losing manufacturing business to the other Tigers because wage costs are increasing in the mainland.

I think the story I found here describes the wage situation in China quite well.
- http://business.globaltimes.cn/china-economy/2011-01/617201.html

The story describes a situation where living costs are now growing at such a clip that workers are simply walking out of their jobs and not returning from their Chinese New Year holiday since wages are not enough to pay their living expenses.  The impact of this is that manufacturers are being forced to delay shipments to the world (for useless junk we don't need).  This means that US retailers can't get the products that they have ordered.  Finally, the Chinese government is attempting to force wages up with regulations requiring minimum greater minimum wages.  In time, this will help and will create a huge domestic economy --- the economy all of the US multi-nationals have all been dreaming of for the last 20 years (remember Dell salivating about making manufacturing plants in China in the late 90's).  This future huge economy is what I've discussed for a while as the reason for investing in the emerging markets.  I've said it a few times, there will be really big draw downs, but in 20 years we'll be giving each other high fives for investing in these gems.


OK, THAT'S A GREAT LONG TERM VIEW, BUT WHAT ABOUT NOW?  - TECHNICAL TRADING UPDATE
Take a look at the two charts above, but let's start with the the colorful black one right above this section.  What we see here is that FXI has pretty significant support at $42 and overhead resistance at $47.  The biggest concern we have is the lower channel trend line that was recently broken last week.  This action to me spells further weakness.  If the $42 area of support breaks FXI could easily trade down to $36 ---- (another 15% or 20% from here).

Finally, examine the upper chart.  I use this chart to examine the 14 day EMA and the 40 day EMA on a weekly chart.  Typically when we see the breakthrough of the 14 day EMA below the 40 day EMA it is a harbinger of doom!  (ok, that may be a bit dramatic, but it isn't a positive).  For me, when this signal appears it signal is a longer term sign that the trend has turned negative.  Let me be clear, it has not crossed below yet, but when it does, it may be a great opportunity to short.   I've posted many articles about this signal in the past, one of the best has been VLO where it signaled a positive move up when the stock was in the $18 - $19 area in November 2010.  That signal (along with good fundamentals) has proved to be an awesome long term trade.

Keep watching, but with continued inflationary forces bruising the Chinese economy along with a confirmation of the 14 day EMA/40 day EMA crossover, I'd be inclined to trade this.