Showing posts with label rails. Show all posts

Tuesday, May 8, 2012

MAY MACRO UPDATE - LET'S GET TO THE END


THE NUMBER OF OUTCOMES ARE DIMINISHING
The good thing about time and uncertainty is that as time passes, uncertainty also usually fades away.  I have found this to be the case in so many areas of life, especially in dealing with the family situation I've been a part of for the last couple of months.  I typically like to have a good plan (guess) of what will happen and then I like to make small adjustments to the plan as reality unfolds.  I stress out when the number of variables are so large that I can't truly grasp what will ultimately happen.  As you get closer to specific dates or milestones, your choices tend to be reduced and your actions are often dictated by one or two choices rather than ten or eleven.  Oddly, that has been the scenario we've all been investing and trading in for the last several years.  Will we wake up with a "fat finger" flash crash event, will another big black swan hit the markets destroying what is left, will Europe's experiment with the Euro finally be ended?  Each day I've wondered how will these events happen and what will the resulting impact be on us.  The trouble with trying to really dig into these uncertainties from afar is you'll have so many unanswerable questions and scenarios that you'll drive yourself crazy attempting to create contingency plans.

Before I delve into the notion that our choices and investing outcomes are now becoming less complex, let's look at the Monthly Update and catch up on a few things going on in the macro-environment.

RAILS - http://railfax.transmatch.com/
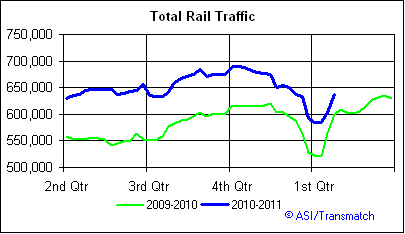
Railroad traffic has continued its rebound after a collapse in late 2010 and early 2011.  The rate of change of growth has certainly slowed in 2012, but tonnage has been solid.  We can expect this kind of trend to continue if fuel prices continue to move higher as shippers will look for any alternative other than land based truck freight to save on transport.

Coal shipments and grains are falling but the fall in these is being offset by higher metal, auto, and construction supplies.  If the summer is as hot as last year coal may rebound as utilities require more of the dirty fuel to meet peak demands in the heat.


SCRAP - http://www.scrap.net/cgi-bin/composite_prices.cgi?id=100000&num=5
Nothing new is happening with scrap pricing as it continues to trade at the whim of inflation and the USD.  The scrap metal index has fallen some 15% since its peak in February 2011, but is still 13% higher than June of 2010.  Expectations of continued inflationary "heating" up are diminishing and therefore we should see scrap decline.  Uncle Alan Greenspan tracked this indicator as a measure of the health of an economy, and thus we'd suggest that it is in agreement with the idea that the US economy has cooled and probably will continue to do so.


REAL ESTATE - http://www.realtor.org/topics/existing-home-sales
Housing is fixed!  Housing is fixed!  Errr.... perhaps it isn't.  Below is a nice little graph that seems to indicate that housing just isn't quite fixed yet.  In fact, a brief look at this chart might lead us to believe that well see a spike in home prices over the summer, but the price surge will remain lower than the previous lower high, leading to another lower low.  I continue to believe that houses (personal homes) are not investments and that is going to be proved out more and more as homeowners come to grips with the reality that their single largest investment isn't a very good one.  On the other hand, rental houses bought cheaply with very little debt may be a wonderful investment as more and more individuals discover they just can't afford the American dream anymore as their income is eroded by the cost of living that isn't tracked in the CPI.


FINANCIAL CONDITIONS INDEX - http://www.bloomberg.com/quote/BFCIUS:IND
The Financial Conditions Index still signals a contraction in the economy.  Try as the Fed may with all of its liquidity storm and steroid pumped printing presses they still haven't been able to push the Financial Conditions Index into expansionary territory for more than a few weeks.  Does this indicate a collapse?  No, in fact we just may be sitting in this steady state of blah that reveals that the US economy is just not so good, and not so bad all at the same time.


EMPLOYMENT - MONSTER JOBS INDEX - http://www.about-monster.com/employment-index
Clearly the Monster.com Jobs Index is showing some good news.  The Jobs Index tracks the number of online ads the firm has and this gives us an idea of how well the employment situation is at a given time.  As the chart expresses, we are near a 3 year high for job placement ads and this is excellent.  This indicator highlights that employers are in fact looking for candidates.  It is also clear from other statistics that is is an awful time to be poorly educated and underscores the need for specialized training and higher education.  Remember, I rag on college education all of the time for being too expensive, but I never suggest that it isn't good, and some type of technical skill isn't required.  I simply am saying that people need to weigh and balance their expenditures on higher education with what they plan to actually do in life.

Apparently, the work from home gig is easy big money and awesome as I got 3 emails today suggesting that I can replace my income in just a few months by working at home.  Why the heck isn't the 8.1% of the US population out there that is still looking for a job not jumping on this easy money?


BALTIC DRY GOODS INDEX -http://www.bloomberg.com/quote/BDIY:IND
The Baltic Dry Goods Index is still low, but has recovered from its descent into the bowels of nothingness.  I think the best way to look at this index is through a much longer term lens than can be seen here on the 1 year chart below.  A longer view shows that the index went from 120,000 to less than 1,000 in about 3 year's time.  Essentially, the $BDI should hover here in this area until we see a sustained rebound in inflation in the emerging markets including China and also in the USA.


6 MONTH LIBORGraphs and Rates
I wanted to highlight two key things in posting the 6 Month USD Libor chart with the 6 Month Euribor rate below it.  Note that the 6 month rate for USD Libor is around 75 bps and this is near 1 year highs for this metric of "trust" between banks.  This rate climbed steadily after August of 2011 and has plateaued in January of 2012.  Essentially, we saw a rise in rates and frankly this was probably seen as healthy as US bond rates were beginning to rise as the US economy was perceived to be improving.


6 MONTH EURIBOR -
While the chart I've used here for 6 Month Euribor highlights a longer term perspective, yet in Euribor terms we see the a contraction in rates that I personally believe can only be attributed to government coordination (ECB, FED, IMF, etc) as the weakness of the PIIGS is getting more pervasive.  Extra-governmental organizations are doing everything they can to throw liquidity at a situation we all know is unmanageable in the longer term.


USD INDEX  -
Today's closing print of 79.84 for the USD Index brings it that much closer to breaking above the critical 80 level where it hasn't been for almost two years (there were a brief couple of months above, but nothing sustained.)  Is it fear that makes the dollar the haven when the other parts of the world seem to be coming unglued?  Is it just a lack of alternatives?  It is probably both of these as investors are now running away from the Euro and finding anything else that might be a safe haven in this storm.  If and when we see the USD Index move substantially over this key level, we'll know that a real firestorm has brewed overseas in Europe.


10 YR TREASURY - Marketwatch and Bloomberg
The charts below show the 10 year Treasury bond rates.  As of today's close we settled at 1.845%, which is well below the recent highs of 2.25% of just a few months ago when everything in the world was perfect.  Today, post Greek and French elections....not so perfect.  The incredible bull market in treasury bonds continues to defy all logic and as the PIIGS continue their slide and their bonds are shunned, US treasuries will be bought and once again we'll see TLT push to even higher highs.  It is so fashionable to call a top in treasuries, but until the US is perceived as "just as bad" rather than "less bad" then our easy funding will continue.


WHERE NEXT? - TRADING UPDATE
When markets were roaring it was very hard to find anyone that questioned the ability of US markets to rip higher.  Emerging markets also were able to rebound and the last 6 months prior to mid April were simply a dream of positive performance.  Jobs data as contrived as it is with BLS manipulation seemed stronger and stronger, consumer spending had no limits, and manufacturing just continued to improve.  With the passage of a week or two, suddenly the world seems a bit dimmer and there is risk everywhere.  Could it just be a few pieces of slowing Chinese data?  Is it really word of another Spanish bank bailout?  Do elections in Greece and France really matter at all?  The answer of course is yes, and all of these things have come together in one instance to conspire against a run at all time highs in domestic equity markets.  Will the negative news prevail?  Perhaps.... and perhaps not.

On the horizon in coming weeks, we have the Facebook IPO that should wow us all and excite the trading bots a few hundred million times in the first second or so of trading.  We should also hear if the anti-austerity left in Greece is able to actual form a government.

GOLD & SILVER & OTHER METALS
Unless and until we see Chinese inflation, all bets are off on the shiny stuff.  Silver and gold could endure some serious technical damage as they continue to slide.  One strange thing we are not seeing though is a swarm by European holders of cash to buy gold as an anti-currency move.  I can only guess that we are not seeing a "Euro-collapse, buy gold response" because everyone has already hunkered down and has already diversified as much as they can into physical assets.

I personally will pick up another few ounces of gold and more silver if we near $1,400 and $26.00.

OIL, GASOLINE, AND NATURAL GAS
As long as we don't have a Middle East eruption involving Israel and Iran, we should see oil continue to fall.  Along with the slide in oil, I've suggested that May 1st was a good time to exit gasoline related trades, and that would have been a very nice exit.  Oddly, natural gas may actually be a bullish play here as we are now finally starting to hear about production being shut in.  The last couple of weeks have actually seen natural gas go higher, which is frankly very strange indeed!  NO, YOU MAY NOT BUY UNG, IT IS A PIECE OF SH$T!!! (Sorry to be profane, but I knew what you were thinking!)

IS THERE A REASON TO NOT COUNT EQUITIES OUT?
If US GDP is leveling off or falling and global investing insecurity is rising, why or how could equities still be a place to invest given that I've said for six months that you should exit in May and stay away?  Well, frankly, getting out then would have been a great strategy and if you are disciplined and have been long and in the market, then you have done well and you might consider it.  If you are one of those long only guys that hates the idea of sitting in cash even when markets are falling, then I'm talking to you!

Again, I need to emphasize that I write this because I know that some of you will demand to stay long rather than exit or even short the market.  As a result, your play here is centered on the "relative performance" aspect of fund managers as we've discussed over time.  In the past we've discussed how defensive times require you to consider utilities, healthcare, consumer staples, and defense sectors. Any continued fall in markets and a perceived overall weakness in the domestic economy will cause fund managers to rebalance and overweight these sectors.  Of course these are all dividend paying types of firms and this too will entice investors to hide here in a  relative yield search.  Essentially treasuries and corporate bonds are so overbought and expensive, new money purchasing these bonds earn you less yield than the purchase of the dividend paying company equity.  Money managers look at this risk/reward trade off and often will lean to the equity saying that it is cheap relative to the credit.  Since investors have piled out of the rigged casino....errrr stock market, they have looked to corporate bonds and have bid them up so high, stocks may be cheap.

Other institutional investors also will suggest that earnings have been great (compared to lowered analyst expectations of course) and also that the US consumer is going wild and is unstoppable, thus the spending data supports that notion that the US economy is not going to derail.

All of those positive items may be reason to support the stock market as we've said, the economy isn't the market and the market isn't the economy, so anything is possible especially when you have the threat of a round of QE loaded in the 3-barrel QE FED shotgun.  I think the key risk here is that even if you are picking up a 3% yield in your stock, you have the risk of giving up a tremendous amount of gains you've earned and could risk a part of your initial investment.  A good stock to look at to examine this action is CAT.  This stock is one I've liked for a long time and yet all of the gains earned in this name could be in danger if you still are holding it.  A friend of mine did not sell it when I advocated letting it go near $110, I think we both wish he'd had been willing to just hold cash.


REDUCING POTENTIAL OUTCOMES
I am excited to see what the coming week brings.  We are nearing a point in the Euro experiment where countries are at the tipping point and citizens have realized, really realized that "global citizen" bankers, politicians, and billionaires, are men and women without honor, without country, and allegiance to only the elite firms that provide them power.  The people of these countries are beginning to embrace nationalism rather than globalism as the deception of a global village and Euro unity has left them poorer and without industry, saddled  with unpayable debt.  As we get clarity on the direction of new governments in France and Greece we'll see that the number of outcomes reduced and be able to invest accordingly.  Until then, I'm sure that we'll see new and more emergency liquidity from every side of the pond

The coming events will serve to essentially make our investment decisions binary in the sense that we can trade according to the assumption that the Euro survives or doesn't.  If Greece exits, surely it will lead to an exodus by Spain and Portugal at least.  Clearly those economies will suffer for at least a couple of years if the global financial system can survive.  While I can imagine many other scenarios about a global financial meltdown and even potentially a stronger Euro after a big fall, the easy trade frankly is that the USD will be much stronger in the short run relative to the Euro.  That strong dollar leads to other plays like a continued short on gold, silver, and oil.  Further justification is found in the lack of strong Chinese data suggesting that global inflation is down and almost out in this round.  


GOATMUG

Goatmug is an investor that cares about you and your family. Goatmug's Blog - Financial Perspectives From The Mountain Top is a collection of thoughts on our economy and how it impacts the lives of investors and average people. While several specific investments are named in many of his posts, these articles are simply invitations for you to do your own research and reference to these securities does not constitute financial advice. Your situation is complex and unique and you should seek professional assistance with your trading and investing. Please visit Goatmug and share your comments at http://www.goatmug.blogspot.com/

Wednesday, May 11, 2011

MONTHLY MACRO UPDATE - PART 1

I'm going to try something new this month where I produce the monthly macro report, but break it into two or three slices over the course of a couple of days.  I think this will help you as readers actually take a few moments and look at and digest the data, and it will also help limit my writing fatigue.


TOTAL RAIL TRAFFIC CHART - http://railfax.transmatch.com/
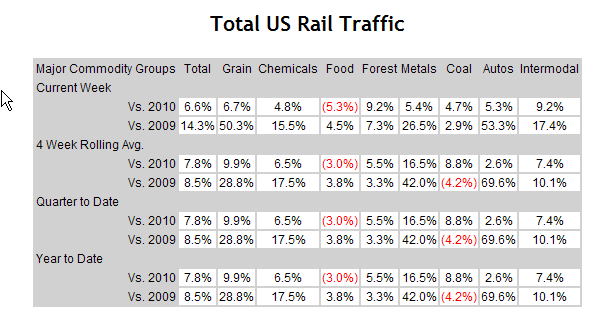
May rails during the first week of May are above last quarter's dip.  The tonnage exceeds last year although the rate of excess over previous months and quarters is certainly declining.  We did have declines in coal, autos, forest products, and food vs last year.  However, year to date all categories are showing increases since 2010's end.


CANADIAN PACIFIC (CP)
Canadian Pacific continues to have worse tonnage shipments compared to last year.  They are the only major player that is facing this issue and therefore this is why I continue to highlight there production.  I'm not crazy about shorting this one at all unless we see a breakdown of the $60.50 area.  At that point, CP would be a true winner from the short side.


AUTOS
Despite the poor weekly performance, Motor Vehicles continue to be shipped at a much higher clip than last year.


WASTE AND SCRAP
Hauling of waste and scrap continues to be muted and in the last few weeks has actually dipped below the 2009 and 2010 trend line. 


SCRAP COMPOSITE INDEX - http://www.scrap.net/cgi-bin/composite_prices.cgi?id=100000&num=5
As noted above with the rail shipping of scrap and waste, the Scrap Composite Index has briefly stopped its ascent.  As we always mention, Alan Greenspan always watched scrap prices as a tell for the direction of the economy.  Since it was good enough for the 2nd biggest bubble blower in the free world, it is good enough as an indicator for Goatmug.


MIT / MOODY'S TRANSACTION INDEX - http://web.mit.edu/cre/research/credl/rca.html
The Moody's / MIT real transaction index data for March 30th 2011 showed another decline of 1.2% on all national real estate transactions.  If you were calling for a recovery in asset prices related to commercial properties, you'd still be looking for it.


NAR HOME SALES - http://www.realtor.org/research/research/ehsdata
NAR reported that home sales actually increased for the first time in several month.  While that may be the case in total, I am interested also to see the distribution of the sales across different price points.  In my area which is mostly affluent, I am seeing a tremendous amount of interest for homes that are in the $800,000 to $1,000,000 and above.  Where I live, that is a very large amount of money (perhaps unlike New York or San Franscisco).   


As you examine this posting from a NAR press release, we will note that this is exactly the case.  Comparisons of prices from one year ago demonstrate that homes from the $100,000 to $750,000 level continue to face declines while those that are able to afford the priciest abodes are actually paying up. 


I've highlighted quite a few times that this economy is becoming two, one where the rich are happy to carry on their lives with little impact, and then another where the middle class and poor scratch to earn an existance.  Clearly, Greenspan's housing bubble took the middle class to the cleaners as they reached beyond their means and were caught in a trap of their own greed and "right" to live in a specific way.  Now you may say that there are those that are blameless, that they couldn't help but purchase houses in a market that was over done because the price was the price.  I will only retort that this is absolutely not true.  They made a decision that was they they deserved a house and that renting was below their means.  They never once looked at their home choice as an investment that could lose, rather many just saw the potential for gains.


If there is some good news this month, it is that the rate of change of food stamp users is finally beginning to slow.  Despite the fact that food stamp usage once again increased, at the slowest pace since November of 2008.  At the end of Febuary we saw that 44.2 million Americans were using food stamps.  This amount is a 11.6% increase year over year.
While this is great news, it should also make you sick to know that the US Government (you) is paying $5.9 Billion a year to support these families.


There you have it for part one.  We are seeing continued stability in the rail shipping area, just an uptick in residential housing, and continued transaction weakness in commercial real estate.  The good news is that food stamp usage growth is slowing too.  In general perhaps we'll see a continued drop in commodity prices as we find out if Mr. Bernanke was correct in his thought that commodity price inflation was merely "transitory".

GOATMUG
Monday, March 14, 2011

MARCH MACRO UPDATE - ALL SIGNS POINT TO WHERE?

We've experienced a 3% drop from the highs since February 18th.  While the 3% drop isn't too significant it certainly feels different than trading has felt over the last year or so.  The fundamentals continue to show a mixed to improving economy although the fuel that has propelled the economy over the last several months is schedule to be discontinued by June when QEII will be halted (perhaps).

Over the last month we've seen surging food and commodity prices that have been been the final straw that unleashed riots and discord throughout the middle east and emerging world.  Oil pierced the $100 level and now we must keep in mind the impact that these high costs will have on the fragile economies of the world.  Finally, the Japanese quake and unfolding disaster there will make the world economy more nervous than ever.  

TOTAL RAILS - http://railfax.transmatch.com/
Rails continue to outpace last year's tonnage with the exception of a downturn in grains and food transportation.


RAILS - AUTOS
We have seen an increase in autos that have been shipped in the last week.


RAILS - SCRAP
Scrap shipping continues to be just on pace with last year.


CANADIAN PACIFIC -
CP has recently underperformed last year's shipping totals and that continues to be the case.  In fact, CP's stock price too has been lagging relative to those other rails and has dropped more significantly compared to the likes of KSU or CSX. 


SCRAP INDEX - http://www.scrap.net/cgi-bin/composite_prices.cgi?id=100000&num=5
The Scrap Composite Index showed its first drop since the second quarter of 2010.  It does appear that there is a seasonal component to the drop if you look at the previous year-end, but it is worth watching. 


HOME PRICES - http://www.realtor.org/research/research/ehsdata
NAR reported another drop in the average home price for the month of January to a shocking $206,700. 
The highs in July of 2010 were pegged at $231,700 which highlights the correction we've seen of $25,000!  If you recall the months of June and July were the cutoff dates for the first-time home buyer tax incentives where buyers could get an extra $6,000 to $8,000 towards their home purchase courtesy of the US government (you and me).  What a complete waste!  We are now below the February 2010 lows.  In other words if you were dumb enough to buy a home based on the home buyer credit, you are close to being underwater.


MOODY'S /  MIT TRANSACTION INDEX (COMMERCIAL REAL ESTATE) - http://web.mit.edu/cre/research/credl/tbi.html
The Moody's MIT real transaction index dipped in December by almost 1 percent, although the entire 4th quarter was quite strong.  In total, the rally is not impressive, yet you've got to keep hope alive and any rebound is great.


MONSTER JOB INDEX - http://about-monster.com/employment-index
The Monster.com Job Index rose to a level of 129 in the month of February which is a 7 percent increase over the previous month.  The year over year growth is only 4%, but is positive.  The rebound is needed as it halted a 4 month slide.  The number of listings are well below the September 2010 levels.


FOOD STAMPS (SNAP DATA) - http://www.fns.usda.gov/pd/34SNAPmonthly.htm
December's SNAP (Foodstamps) data release shows up that there is no let up in the amount of Americans that are taking the government up on available programs to feed the poor.  December showed a 1.12% increase over the previous month and now indicates that there were more than 44.1 million people accepting assistance which is a 13.1% increase from the beginning of 2010.  Back in October of 2010 we saw a slowing in the rate of folks on the food stamp roles, however December marks the second straight month of an increasing rate of usage (the rate of change is increasing).  Obviously this information is dated and hopefully the numbers out of the Monster Employment Index can arrest these startling figures.  My heart is breaking for these people.  If you have any desire to see what is happening right here on US soil to your nation's children, please see the post we completed earlier this week - POVERTY IN THE USA - WHAT NO ONE WANTS TO SEE.


CFO OPTIMISM SURVEY - http://www.cfosurvey.org/11q2/PressRelease.pdf
The Duke / CFO Magazine CFO Survey was released last week and it shows that the bean counters in American businesses are more optimistic than last quarter about the economy.  They also suggest that capital spending will increase, and they predict that dividend distributions will actually be much higher.  There were a couple of reasons to pause though as they stated that they don't see much improvement in the job outlook and that any evidence of inflation could damage their outlook.  Hum.  It seems like this is more of the same here.  Company makes more money, company does not hire more employees.  One other note, the firms CFOs stated that credit conditions were improving, except for smaller firms.   


UCLA FUEL INDEX SURVEY - http://www.ceridianindex.com/
Growth in fuel usage has been slowing since January in this index.  This indicator usually follows movements in the overall indices and therefore I do not use it as a predictive tool, but more of a confirmation of overall economic activity.   


COPPOCK TURN INDICATOR
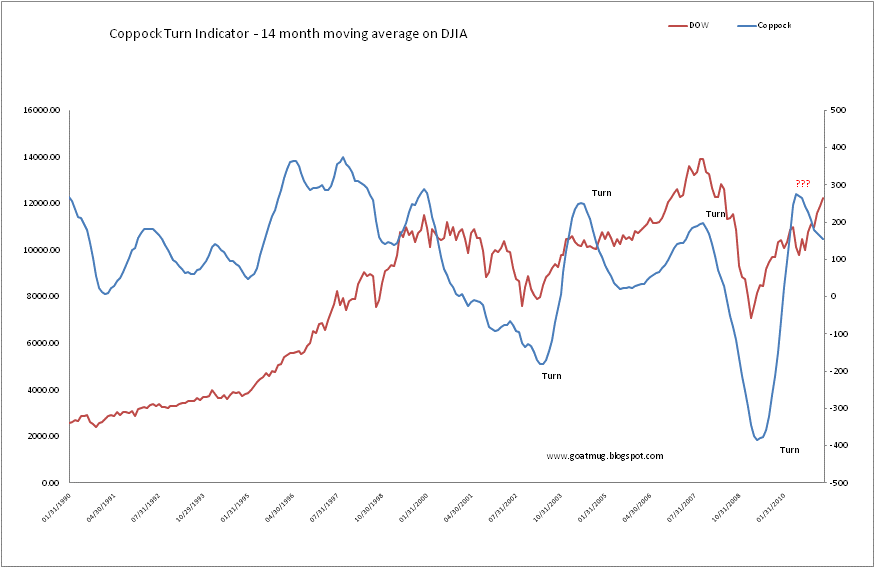
The Coppock Turn Indicator has stubbornly held its negative outlook since it flashed a sell signal all the way back in June of 2010.  If the Dow can move higher than 12125 to close for the month of March it will actually flip to bullish.  As I often comment, I think we've seen that the Coppock is pretty unreliable, but I am keeping it updated for entertainment purposes only.  Perhaps we'll see the Dow at 10500 again soon, but clearly the indicator missed out on a 2000 point ride north since then.

US FINANCIAL CONDITIONS INDEX - http://www.bloomberg.com/apps/quote?ticker=BFCIUS:IND
As we have seen over the last several months, whenever the US Financial Conditions Index eclipses the 0.0 mark it stalls out.  The zero level indicates that the economy is expanding, thus leaving recession behind.  Each time we've seen the FCI hit the 0.5 level it is slammed back and these last several weeks have been no exception.  I perceive this as a warning sign that the economy is still not out of the woods, although perhaps another $600 Billion of QE III might get us up to 1.0 at least, don't you think?  As of Friday the index was back at 0.148.


BALTIC DRY GOODS INDEX - http://www.bloomberg.com/apps/quote?ticker=BDIY:IND
The Baltic Dry Goods Index did see a reversal over the last month and has rebounded strongly.  I am guessing that part of the rebound has been directly related to stockpiling of dry goods such as grains as a result of the unrest in the Middle East.  The timing looks pretty good as an explanation for the significant move up in spot rates.


US DOLLAR - http://www.bloomberg.com/apps/quote?ticker=DXY:IND
Is that a tick up I see?  Strange.  While it is odd to see the dollar move up, I would suggest that this actually could be something we might see continue for a week or two more as this correction in equity markets develops.  We did see the dollar fall on Friday.  The dollar is at a critical place here where it needs to find support.  If not, we could easily see it usher in a new blast lower to areas not previously seen.  The push lower would cause renewed spikes in precious metals and other commodities like copper and oil.


6 MONTH LIBOR -  http://www.homefinance.nl/english/international-interest-rates/euribor-rates-6-months.asp
As we noted earlier last week, 6 Month Libor continues to move higher.  There have been rumors of interest rate hikes in Europe, as a move to stave off inflation, but the weakness in the banking system there simply makes me think that it cannot be done.  We are seeing lots of talk, but little real action.


TRADING UPDATE
In favor of getting this post up for the beginning of the week I am going to cut things a bit short and make every effort to post over the next couple of days a deeper look at specific areas where trading is at a critical juncture. Overall, markets for the last couple of weeks seem to be consolidating and trying to churn through some new selling. The selling hasn't been overwhelming, but heck, it is new to actually see selling! Remember, in our 2011 Forecast we identified March as a critical month due to the idea that big players would not wait to exit markets as QEII terminated. In other words, big funds and hedgies weren't going to wait for June to roll around before exiting positions. If the FED quits buying treasuries then that means that they quit exchanging those treasuries for dollars which somehow find their way into other speculative assets (food and other commodities anyone?). It would not be too hard to believe that we may see a decline in the thrust upward in many of these very frothy "investments" if the fund managers and primary dealers suddenly think that they may lose their source of fuel.
I don't want to get too over zealous though because markets are still weak enough that all it would take to see a huge snap back rally higher is an announcement from Fed officials that weakness is too great to stop these open market actions and QEII will actually be extended with a new batch of electronic cash. I also think that the Japanese disaster is just about enough of an excuse to put all free-market exercises on hold for another 6 months. There will always be a reason to extend an pretend as long as you have a printing press at your fingertips!

Overall, as I mentioned at the top of the post, information is mixed to improving. The overall job picture is getting better, but that doesn't mean that incomes are up. The CFO survey indicates that there are areas where there will be job growth, but as they see it, jobs won't be the big winner in the next quarter. Housing just can't get better and the decline in home prices are really troubling.

I will leave you with this last nugget that I put together with Robert Schiller's Irrational Exuberance data at http://www.irrationalexuberance.com/ . What I'm highlighting here is that we are at P/E levels that have been experienced around 6 other periods in the last 90 years. In each instance, stock markets corrected pretty significantly after those levels were reached. Now this is not to say that the correction is immediate (for goodness sakes, look at the 2000's!), but it is sort of like the treasury trade where we know that we are at historic lows and it is a pretty good bet that we'll see higher rates in the future. In the same manner, we know that we are at high P/E's and there is a safe bet somewhere and at some time that suggests that they will go lower and so will the markets. This is just one more warning that should be going off in our minds that there is risk in this system and we need to be fully aware that things could break down. The obvious question is simply when.


As markets open we should see Japan drop significantly with a carry through of the decline to as much as 10% in coming weeks. There will probably be a rebound due to printing of liquidity. One quick note on oil and other energy fuels, we should also see a drop in oil as there will be a drop in economic activity in Japan and Asia as a result of the disaster. I see this as temporary as the unrest in the Middle East is not going away and I continue to watch for the Saudis to demonstrate and attempt to overthrow their leadership. If any momentum is built in that country, oil and gas will rocket higher.


GOATMUG

Wednesday, February 9, 2011

FEBRUARY MACRO UPDATE - RECOVERY IN ASSET PRICE ONLY?

RAILS - http://railfax.transmatch.com/
Rails continue their march higher in terms of their increases in shipments compared to 2010 and 2009, with the exception of food.  Interesting decrease here, but as with all economic statistics that underperform we'll just blame the weather.  I recall my days as a Financial Analyst doing budgets for a big company where I simply used "timing differences" as my excuse for variances I simply had no idea why they were off.  I think "weather" is just like a timing difference.
TOTAL RAILS
We saw a season dip over the last month and now we are back into the ramp up stage.  It is important to have seen that we didn't cross below the 2010 levels here.

AUTOS
Motor vehicle shipments continue to be of concern as we just are increasing the shipments like we should given the super recovery that we have been promised.  Ford's disappointing report over the last week was essentially tipped by watching the rail shipping data below.  It won't be hard to imagine that GM comes out with numbers that are quite as good either.  Have you noticed that GM hasn't been able to exceed that $39 mark we highlighted several weeks ago?


RAILS / SCRAP TONNAGE
Scrap shipments continue to go along the trend line from last year.  Essentially the data here, with autos, and a few other items we'll review shows that this is a "recovery-less recovery" (yes, Goatmug owns the trademark on that!).


KSU - I've captured a few snapshots of individual rail tonnage for you.  All seem pretty similar, but the hope is to find the weak one of the bunch.  Let's see if we can find it.


NORFOLK SOUTHERN -
Looks actually a bit better than KSU.


CANADIAN PACIFIC - Uh oh, one of these pledges is not like the others.  (Remember, stock performance is all about expectations.  I would contend that that dip below 2010 levels may not be a positive.  I have looked at CP's chart though and it is pretty impressive.)


SCRAP COMPOSITE PRICE INDEX -
http://www.scrap.net/cgi-bin/composite_prices.cgi?id=100000&num=5
Scrap prices were Alan Greenspan's favorite macro-indicator, but I'm wondering if all macro-indicators are worthless in this asset price melt up and dollar meltdown environment.  This beautiful chart just continues to go up and to the right.


AVERAGE PRICE - HOME SALES - http://www.realtor.org/research/research/ehsdata
December home prices were released and we continue to see real estate decline.  The effects of QE II have just begun to impact mortgage rates (in this data) and we can only assume that the home price slide will accelerate.


ARCHITECTURE BILLINGS INDEX - http://www.aia.org/practicing/economics/AIAS076265
In my quest to add more indicators, my buddy Carrz suggested that we should use the Architecture Index.  Billings and Inquires are up based on their December survey.


MOODY'S / MIT TRANSACTION INDEX - http://web.mit.edu/cre/research/credl/rca.html
The Moody's / MIT Transaction Index recorded another rise of .6% for the month of November (released last week of Jan).  Commercial real estate has been very solid here and has not declined further.  Has the the bottom been made and are we in the clear?


MONSTER.COM INDEX -  http://about-monster.com/employment/index/15
While real estate prices may be going higher, job prospects seem to be not getting better.  In fact, the Monster.com job listing index has recorded another monthly decline.  Essentially Monster.com records the number of online job listings that are available.  This is the fourth straight drop in this data.  Are all the positions taken?  Monster tried to spin this and state that this is a 7% increase from the previous year's level, but I don't see it that way.  January of 2010 was the edge of the cliff, are we really expecting to be way over this level?


FOOD STAMPS - SNAP DATA - http://www.fns.usda.gov/pd/34SNAPmonthly.htm
Below is a graphic of the most recent food stamp data.  Almost 43.6 million, ok let's be exact 43,595,000 are obtaining food stamps at a cost of $5.8 billion!  Essentially each person is receiving $133 a month in government food assistance.


UCLA / CERIDIAN FUEL INDEX - http://www.ceridianindex.com/
January's release of the PCI shows a slight decline from December's big gains.  Ultimately this can probably be blamed on weather if you can believe it (and I actually do believe it for this stat!).


COPPOCK TURN INDICATOR


6 MONTH EURIBOR -
http://www.homefinance.nl/english/international-interest-rates/euribor-rates-6-months.asp
Interbank lending rates continue to climb.  We haven't heard much about Europe over the last couple of days, but we should keep Greece in mind and not be eased into any complacency.  It is coming, it is just a matter of when, rather than if.


US FINANCIAL CONDITIONS INDEX -
http://www.bloomberg.com/apps/quote?ticker=BFCIUS:IND
The US Financial Conditions Index not is solidly above zero which indicates that the economy is expanding.


BALTIC DRY GOODS INDEX -
http://www.bloomberg.com/apps/quote?ticker=BDIY&exch=IND&x=15&y=11
The Baltic Dry Goods Index continues its free fall.  Spot shipping rates are simply off the cliff and it is anyone's guess as to when the drop will abate.


USD - http://www.bloomberg.com/apps/quote?ticker=DXY:IND
The USD Index is captured below.  One might expect a defense of these levels here,. but one might expect alot of things in this economy that don't happen.  If we do see some strength in the dollar, we would expect to see the commodities complex sell off and perhaps the equity market too.  If we see more declines in the dollar index, we should see Garth and Ben out yelling "Party On Wayne!"


CORN -
Commodities like the softs (corn, wheat, etc) continue to rock.  Take a look at the graph for corn and note that we are right back at the levels of the summer of 2008 where President Bush happily signed the corn/ethanol subsidy bill and made life hard for Mexican families that choose to consume corn tortillas.  Isn't it great that we still subsidize corn based ethanol despite the fact that it is terribly wasteful and inefficient!  Wouldn't that corn be better placed in the stomachs of people rather than the fuel tanks of autos?


COMMODITIES SNAPSHOT -
Here is a neat snapshot of all of the commodities for the last 1 year period.  As Ben Bernanke testified today, there is no inflation, but they are watching the increase in commodity prices closely.  Hopefully they are watching those price levels rather than the same screens as the folks at the SEC. http://abcnews.go.com/GMA/sec-pornography-employees-spent-hours-surfing-porn-sites/story?id=10452544  (Remember this awesome revelation from April 2010?)


TRADING UPDATE
I want to wrap up and I'm forced to take a deep sigh.  We really have a mixed bag still where some portions of the economy look have begun their recovery and other parts are simply mired in a funk. 

Rail shipping looks to be improving or at least remaining at higher levels.
Commercial real estate seems poised to move higher.
Employment could go either way, but I'm leaning to the side of a slowing of hiring as opportunities are gone (filled or simply the job was removed).
Housing stinks and is essentially a lost asset at this point, especially with the specter of higher interest rates.
Commodities will soon hit the level where they inhibit any recovery in the global economy so I think there is limited upside.
Credit concerns have not abated and we are seeing discussions of haircuts in Greece and CDS blowing out to all time highs for Portugal.

With all of these negatives and a few positives it is just amazing to me to see many of the indices trading at or near July 2007 highs (and near almost all-time highs of Oct 2007).  I've struggled with how to characterize this economic and stock price move and I think the best way to capture it is to say that this has been a "RECOVERY IN ASSET PRICE ONLY".  In other words, the economy comeback we've seen is only in the levels of stock indices rather than in the basic fundamentals in the real economy.

Emerging markets continue to be of great concern for me thus today's FXI update and I still remain bullish on energy here as described in the 2011 outlook.  We have made it through January without the correction that I've been looking for, I don't know if it is merely delayed or just not coming.  My thesis that we'll see strength domestically through the first 4 or 5 months of the year still looks good but that is no reason to not remain vigilant.

GOATMUG