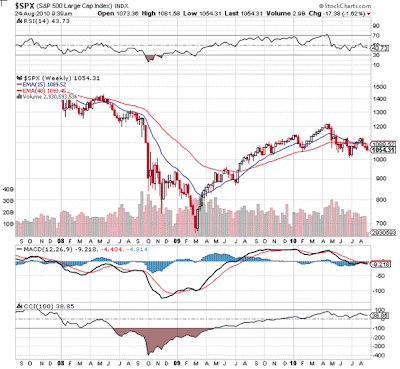
In fact, when we see this signal, it tells us that we should consider looking to short the market and go long treasuries (not sure if I'd do the treasury part).
I have found an article by one of my favorite bloggers on the subject (way at the bottom where Chris Puplava discussed the cross). Please find a more in depth view in this link. - Chris Puplava Article
"Cyclical Bull/Bear Market Signals
To finish off today’s article, a quick peak at some indicators that have helped identify turning points between bull and bear cyclical markets to see if any signals have been given after the swoon to last week’s lows in the market. Looking at the S&P 500 15/40 weekly EMA signal system as well as the stock/bond ratio 15/40 weekly EMA signal system shows that no sell signals have been given and the trend remains bullish until proven otherwise. Additionally, bear markets are often associated with the 14 week RSI dipping into bear territory below 50 (red boxes below), and last week’s lows never saw the 14-week RSI on the S&P 500 dip below 50, with the 50 mark acting as support. The January 2010 top may in fact prove to be THE top for the March 2009 cyclical bull market, but it is perhaps wise to wait for confirmation before ringing any bear market alarm bells. A break of the 15 week EMA below the 40 week EMA for the S&P 500 and the stock/bond ratio, along with a decline below 50 on the 14-week RSI would provide solid corroborating evidence that the present cyclical bull market is over. However, if these indicators hold in bullish territory the bulls have the upper hand and the recent correction would prove to be a buying opportunity rather than the start of a new bear market. "
Current numbers as of 8/24/2010 - 9AM CST
15 Day EMA - 1089.38
40 Day EMA - 1090.40
RSI - 43.60 (Below 50)
This would show a confirmation of a sell signal.
GOATMUG


