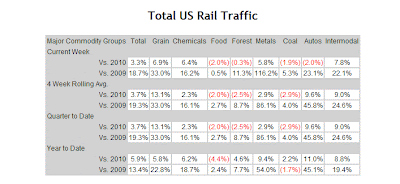
TOTAL RAIL TRAFFIC CHART - http://railfax.transmatch.com/
May rails during the first week of May are above last quarter's dip. The tonnage exceeds last year although the rate of excess over previous months and quarters is certainly declining. We did have declines in coal, autos, forest products, and food vs last year. However, year to date all categories are showing increases since 2010's end.
CANADIAN PACIFIC (CP)
Canadian Pacific continues to have worse tonnage shipments compared to last year. They are the only major player that is facing this issue and therefore this is why I continue to highlight there production. I'm not crazy about shorting this one at all unless we see a breakdown of the $60.50 area. At that point, CP would be a true winner from the short side.
AUTOS
Despite the poor weekly performance, Motor Vehicles continue to be shipped at a much higher clip than last year.
WASTE AND SCRAP
Hauling of waste and scrap continues to be muted and in the last few weeks has actually dipped below the 2009 and 2010 trend line.
SCRAP COMPOSITE INDEX - http://www.scrap.net/cgi-bin/composite_prices.cgi?id=100000&num=5
As noted above with the rail shipping of scrap and waste, the Scrap Composite Index has briefly stopped its ascent. As we always mention, Alan Greenspan always watched scrap prices as a tell for the direction of the economy. Since it was good enough for the 2nd biggest bubble blower in the free world, it is good enough as an indicator for Goatmug.
MIT / MOODY'S TRANSACTION INDEX - http://web.mit.edu/cre/research/credl/rca.html
The Moody's / MIT real transaction index data for March 30th 2011 showed another decline of 1.2% on all national real estate transactions. If you were calling for a recovery in asset prices related to commercial properties, you'd still be looking for it.
NAR HOME SALES - http://www.realtor.org/research/research/ehsdata
NAR reported that home sales actually increased for the first time in several month. While that may be the case in total, I am interested also to see the distribution of the sales across different price points. In my area which is mostly affluent, I am seeing a tremendous amount of interest for homes that are in the $800,000 to $1,000,000 and above. Where I live, that is a very large amount of money (perhaps unlike New York or San Franscisco).
As you examine this posting from a NAR press release, we will note that this is exactly the case. Comparisons of prices from one year ago demonstrate that homes from the $100,000 to $750,000 level continue to face declines while those that are able to afford the priciest abodes are actually paying up.
I've highlighted quite a few times that this economy is becoming two, one where the rich are happy to carry on their lives with little impact, and then another where the middle class and poor scratch to earn an existance. Clearly, Greenspan's housing bubble took the middle class to the cleaners as they reached beyond their means and were caught in a trap of their own greed and "right" to live in a specific way. Now you may say that there are those that are blameless, that they couldn't help but purchase houses in a market that was over done because the price was the price. I will only retort that this is absolutely not true. They made a decision that was they they deserved a house and that renting was below their means. They never once looked at their home choice as an investment that could lose, rather many just saw the potential for gains.
FOOD STAMPS - http://www.fns.usda.gov/pd/34SNAPmonthly.htm
If there is some good news this month, it is that the rate of change of food stamp users is finally beginning to slow. Despite the fact that food stamp usage once again increased, at the slowest pace since November of 2008. At the end of Febuary we saw that 44.2 million Americans were using food stamps. This amount is a 11.6% increase year over year.
While this is great news, it should also make you sick to know that the US Government (you) is paying $5.9 Billion a year to support these families.
There you have it for part one. We are seeing continued stability in the rail shipping area, just an uptick in residential housing, and continued transaction weakness in commercial real estate. The good news is that food stamp usage growth is slowing too. In general perhaps we'll see a continued drop in commodity prices as we find out if Mr. Bernanke was correct in his thought that commodity price inflation was merely "transitory".
GOATMUG


