Showing posts with label VLO. Show all posts

Wednesday, February 15, 2012

HAPPY THOUGHTS - MACRO UPDATE FOR FEBRUARY

IT JUST FEELS BETTER 
Clear your mind for a second and forget that there are these things called bonds, that there is a European economic zone called the EU, and that a small little island country called Greece owes a boat load of money to just about everyone.  Don't you feel calm and relaxed?  I thought you might.  Now that you've erased from your consciousness any troubling aspects related the global economic reality, we can focus on good thoughts and ponder just how great things are getting in the USA.  Are you ready?  Let's hit it!


MONSTER EMPLOYMENT INDEX - http://www.about-monster.com/employment/index/15
The Monster.com Employment Index is a metric I like to follow because it gives us a pretty good look at what Monster.com is doing when it comes to on-line job listings.  January is usually a down month, so we can't get too worried about a decline following the year-end holiday.  Despite the drop, we have see a pretty consistent improvement in year-over-year terms where listings have been on a steady 8.5% to 9% increase over the previous year.

It is critical that we don't see a continued slowdown in the trend here through February as it usually marks the turning point for online job listings for the year and typically we see a peak in the late summer and early fall months.


SCRAP COMPOSITE INDEX-
The Maestro, Alan Greenspan, watched the prices on scrap metal as an indicator of financial expansion.  Who are we to argue with the greatest money printer and bubble blower of all time?  Scrap prices were in a serious decline until December when almost every asset on the planet caught a bid.  The move up may indicate that global inflationary forces are at once at work within our economic system.


FOODSTAMPS - SNAP DATA
I wanted to include this information without further comment.  If you missed the recent post on this data, please go to the link at - WHAT'S UP WITH THE PO' FOLK


BLOOMBERG FINANCIAL CONDITIONS INDEX - http://www.bloomberg.com/quote/BFCIUS:IND
The Bloomberg Financial Conditions Index is still below the 0.00 level which highlights in some improbable way that the economy and markets are still in contraction mode.  How is this possible when market indices are nearing October 2007 levels?  Who knows, but the Financial Conditions Index simply reveals that we are still in a recessionary mode, although we are very close to breaking out into the clear again.  Interestingly, each time we have approached a level that was positive or near 1.00, our markets have corrected significantly.


USD INDEX -
The USD's travels to the lower right corner of my chart below puts the US situation in a pretty clear light as we can really evaluate the longer term trend of our currency.  Don't ever question whether out-going Treasury Secretary Geithner wants a strong currency....(cue Chinese student and Goatmug laughter!!).  Another interesting point is that the USD is near the level we saw in October 1, 2007 at $77.81 right as things US markets attempted for a retest of equity highs achieved in July of 2007.  (On 1/31/12 we ended at $77.86)


USD (CON'T) - http://www.bloomberg.com/quote/DXY:IND
Here is a 1 year view of the USD Index.  The fall of the USD in the last two months has been the fuel for much of the stock market rally.  What happens if the fall doesn't continue?


BALTIC DRY GOODS SHIPPING INDEX - 
I'm about to throw the Baltic Dry Goods Index in the pile of "Who Knows What is Happening Here" as we continue to see a monster decline in spot shipping rates for global dry goods transport.  We have heard all of the reasons for the decline, that there is an over-supply of ships coming into the market, depressing the spot price.  We've heard that China is no longer importing commodities at the rate they did previously.  The one serious take away one can make is that shippers are enduring quite a collapse in prices as this index just a few years ago was over $100,000.  It is hard to imagine any company being able to withstand an implosion of 95% of their pricing.  Did I mention these firms are more debt than Greece?  Can't be a good recipe.


INTERBANK LENDING RATES - 6 MOS LIBOR -
Below is a picture of a 25 year history of 6 month Libor rates.  At .75% we can see the affect that this prolonged period of stress has had on lending rates.  In an effort to provide extreme liquidity in the face of bank distrust, central banks have driven inter-bank lending to historic lows.


Euribor also gives us a tip that something coordinated is going on with the banking environment.  Notice in November rates began going down.  As central banks goosed the system we've seen lending rates decline and equity markets rise.  Coincidence?  Probably not, recall that equity market have simply risen without a red day for the last 2 straight months.


TED SPREAD - http://www.bloomberg.com/quote/!TEDSP:IND/chart
Building on the theme from the Euribor chart above we examine the Ted Spread which is another stress or fear indicator.  According to the Ted Spread, everything is just getting finer!


TRADING UPDATE
The year has progressed right along the path that I anticipated it would and as I laid out in my 2012 Predictions post titled CONFIDENCE LOST; 13 For 2012.  What I mean by, "it's progressed like I laid out", I mean that we are moving much higher in the indices and we are making a strong run into the late April or May top we'll see.  Does this mean that there won't be a few down days?  Can it be possible to have a 5% drop here and still keep this thesis in tact?  Of course, in fact, I am looking for a  drop here as even the $SPX is up 8% year-to-date.  If anything, we'd really have to question what would propel the market higher in such a short time wouldn't we? (Tongue and cheek of course!)

I looked back at a few of the items that I was really centered on in the predictions post and I highlighted a few that have easily hit their targets.  WNR and UGA have already hit $17 and $54 respectively.  Each of these have posted pretty respectable gains since I put those on.  I mentioned that VLO could go to $27 and I still believe that is easily in the cards, but it has clearly lagged WNR, (which was and is my favorite).  Here is the deal though, with almost a 50% gain in WNR and a health 20% profit in UGA, is there any reason to press my luck?  No!  In fact, a drop here would be a perfect set up to leg in and rebuy my positions for a move higher into late April and May.  Profit is profit!

I am still very bullish on gasoline and am staying with that slant through the next few months.  I still think there is a possibility that we move as much as 8% to 10% lower in the next couple of weeks.  

TIRED RALLY?
I am trying to keep an open mind about several positions that look very suspect.  I've played around with very small positions on XHB trying to find a successful entry on a short position, but have managed to take a few flesh wounds in the process and have been glad to have stops all the way up as XHB defied gravity last week.  The open mind here comes in play in that this housing etf could very well scream higher to $23 which is the September 2008 level.  XHB bulls are saying that new housing looks to be improving, that the mortgage settlement will clear the path for more new homes, and housing financing rates are low.  A bear might just hear that and say that lots more housing supply is coming online and no one can get financing anyway.

From a chartist perspective I see that XHB has pushed above resistance at the $19.90 level, but has dropped back through it over the last two days AND was trading previously at a level 2 standard deviations above the 50 day SMA on this 3 Yr Weekly Chart.  I like to think that stocks that trade that high above the overall trend will fade back down to at least the overall trend line, so this has been the basis for my short attempts.  


Finally, I don't have the courage to short this one, but if there is a chart that shows something WAY above it's trend and trading well above 2 standard deviations, it would be this little company.  Everything in me says to short it, the last 3 years of history keep me from doing it.


Domestic economic stuff looks pretty good right now and perhaps the US economy is getting on track.  In early January I anticipated a continued improvement in economic metrics in the first half of this year.  I was a bit worried when two of my favorite writers disagreed fully with my analysis and made projections that the first half of the year would be flat and the back half of the year would be strong.  I think both writers felt that the election cycle would come into play and markets would rally.  I feel almost vindicated as Chris Puplava has intimated that he actually sees a reversal setting up in his outlook where the first half is good and the back half is....not so good, which aligns with my stated market direction.  My other favorite writer also has altered his forecast so there I'm not surrounded by folks that agree with my way of thinking.  (Perhaps it is time to change my view?)

For me, the key is that if we have continued Federal Reserve action we will see gasoline surge higher. As gasoline exceeds $4.00 in early April and May, we will see an immediate drop in US domestic economic activity and all these happy thoughts we've been training ourselves to have won't mean much as our growth grinds to a halt.  I've have more on this topic this weekend.

Be Careful!


GOATMUG

Goatmug is an investor that cares about you and your family. Goatmug's Blog - Financial Perspectives From The Mountain Top is a collection of thoughts on our economy and how it impacts the lives of investors and average people. While several specific investments are named in many of his posts, these articles are simply invitations for you to do your own research and reference to these securities does not constitute financial advice. Your situation is complex and unique and you should seek professional assistance with your trading and investing. Please visit Goatmug and share your comments at http://www.goatmug.blogspot.com/ 

Sunday, January 15, 2012

CHART-FOO-YOUNG


A COLLECTION FOR YOUR ENJOYMENT
Here are a few more charts I examined this weekend.  Not really a rhyme or reason for the collection, but I had them so I thought I'd share them.

Don't read too much or too little into the charts and their significance here in the post.  I love some of them as seen through the lens of the thought that May 2012 will be the high for the year, others I hate now and will probably hate more later.

In my mind, PFE looks the most topped out while EWY and EWC look like they could go much higher if we don't have some Euro-crisis in the next week or so.

VLO - VALERO


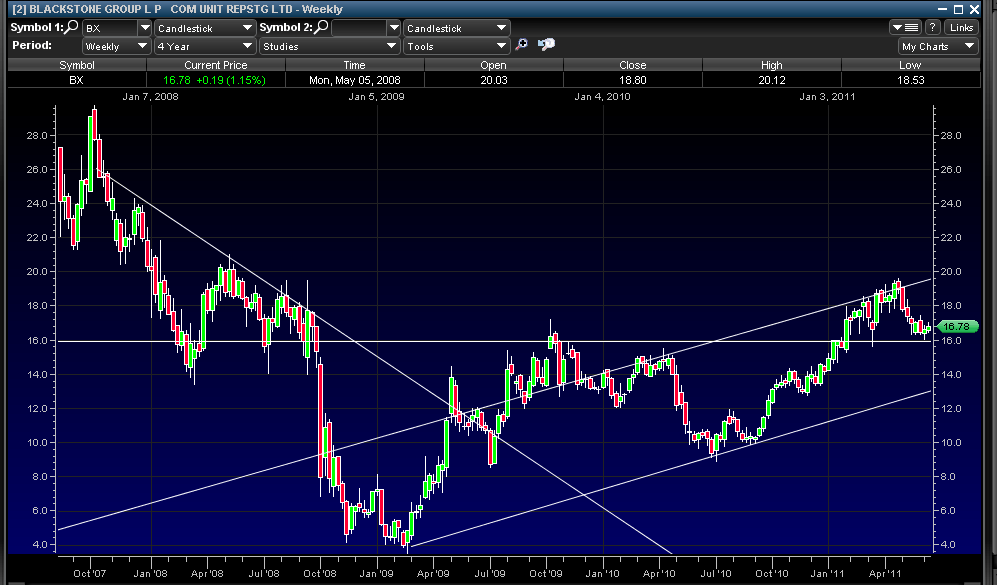
BX - BLACKSTONE


CAT - CATAPILLAR


EWC - CANADA ETF


EWM - MALAYSIA ETF


EWY - SOUTH KOREA


FCX - FREEPORT MCMORAN


MMM - 3M COMPANY


PFE - PFIZER


SHLD - SEARS

Have a great day off from trading and honor Martin Luther King on this wonderful day.


GOATMUG

Goatmug is an investor that cares about you and your family. Goatmug's Blog - Financial Perspectives From The Mountain Top is a collection of thoughts on our economy and how it impacts the lives of investors and average people. While several specific investments are named in many of his posts, these articles are simply invitations for you to do your own research and reference to these securities does not constitute financial advice. Your situation is complex and unique and you should seek professional assistance with your trading and investing. Please visit Goatmug and share your comments at http://www.goatmug.blogspot.com/

Friday, June 17, 2011

LINES IN THE SAND

I've been doing some unusual posts of late and I'm extremely busy.  I've done a lot of looking at charts and I am going to share them with you.  These are positions I've owned for a very long time and have done well in my long term account with.  These are all plays that I've mentioned over the last two years.  Each of them (with the exception of the last 4) look very similar.  I've indicated ones that I actually sold this week, but also have indicated my levels for stops if I still have them.  I don't have time for any commentary on any of them, check out the charts and look at the stop levels, if the stock or eft is below that level, then I'm probably out.

As you know, I expect some sort of resolution to the Greek issue because the ECB cannot let that fail.  We will or should get some relief rally, but I think the bond market will immediately attack Italy, Spain, Portugal, and Ireland again, and we'll reface this same scenario and it will really hurt the prospects in the market till late summer or early September when we have some sort of new stimulus.

By the way, the short on RIMM that I've held on and off for a very long time (since mention on April 5th) has worked nicely.  I'm out of that trade now.  http://goatmug.blogspot.com/2011/04/apple-resting-or-shift-in-play.html


XLE (ENERGY)
Stop $71.45


EWZ - BRAZIL
($71.45 - Sell)

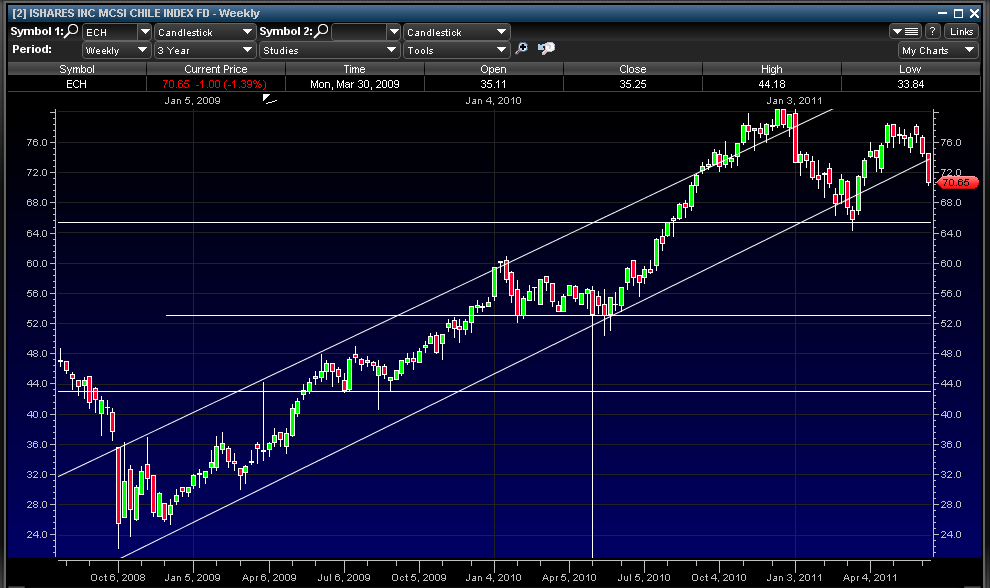
ECH - CHILE
$73.62 - SELL

EWC - CANADA
$30.25

EWM - $14.12

XLI - INDUSTRIALS
$35.75

VLO
$24

UGA - GASOLINE
$48


DBC - COMMODITIES
$28.40

BX -  BLACKSTONE 
$16


DEFENSIVE THEMES - NOT SELLING HERE
XLU - UTILITIES
$30.75


PPA - DEFENSE
$17.50


XLV - HEALTH CARE
$31.66


XLP - CONSUMER STAPLES
$28.80
 
 
That's it, no more commentary than that.  Be careful and blow out of positions that could crush you.  Chances are we get a relief rally this weekend, but it will be short lived and that will be the chance to unload positions that you don't want to have for a long time at lower prices.
 
Please check out the blog at http://www.goatmug.blogspot.com/ I'm got some good things cooking for the weekend.
 
Goatmug is an investor that cares about you and your family. Goatmug's Blog - Financial Perspectives From The Mountain Top is a collection of thoughts on our economy and how it impacts the lives of investors and average people. While several specific investments are named in many of his posts, these articles are simply invitations for you to do your own research and reference to these securities does not constitute financial advice. Your situation is complex and unique and you should seek professional assistance with your trading and investing. Please visit Goatmug and share your comments at www.goatmug.blogspot.com.

Wednesday, February 2, 2011

CHINA - GREAT BIG LOVEABLE PANDA OR BLOOD THIRSTY BEAR?

Lately I've been doing more writing and have been highlighting the battle that is being waged in the economy.  In my recent article Inflation Bombs, I discussed how the US central bank was using dollar devaluation to inflate assets (stocks and commodities).  The next major post highlighted the Japanese experience with deflation in Why Aren't We Turning Japanese
The key takeaway in these posts is that our US FED has opted to inflate assets and the by-product of that choice is a flood of speculative dollars deployed throughout the world.  The result of the deluge has been massive increases in commodity prices, tougher living conditions for the poor and retired, and an increase cost of living for US and world citizens. 

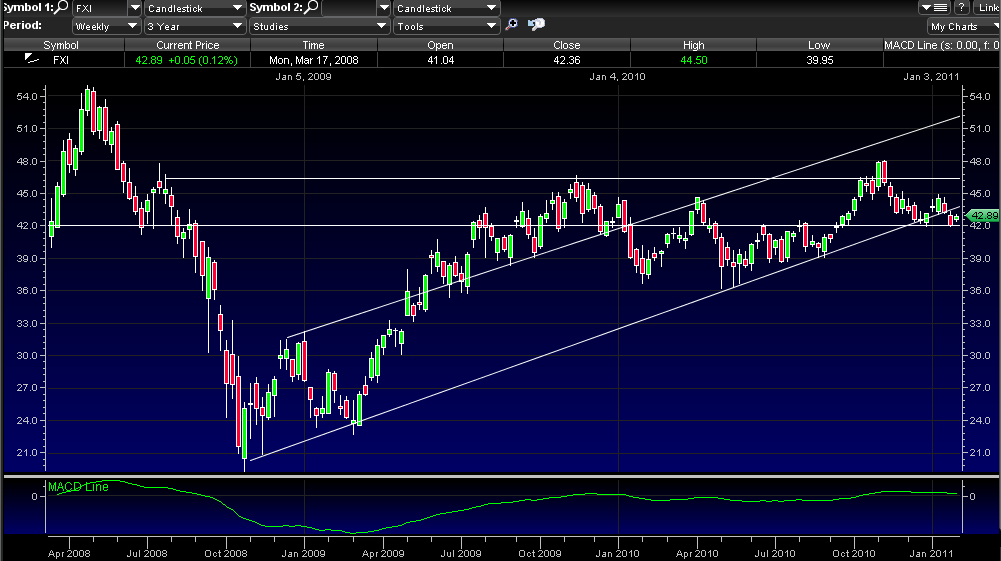
I received a few comments from a reader the other day and the basic thrust of his comments were that China and the emerging economies were an easy choice for us to make when compared to the recessionary economy of the US.  While there is part of me that agrees with him fully we need to make a distinction between "economy" and stock or commodity investing targets (of course time frame is important too).  My statement is made clear as we examine the chart below and see that the FXI has dropped some 11% from it's recent highs in November. 


FUNDAMENTAL VIEW
From a fundamental long term perspective I think the reader has the correct investment thesis (of course I like it because I've had it and traded on it for the last 18 months!).  However, the short-term in China has me taking a pause because the charts are telling me that we are at an inflection point.  We'll talk about those technical trading markers in a second.  First though, I'll put China in the same basket as all the other emergings that I like. 

POSITIVES
Relative Low Employment Costs (to Europe or the US)
Little Environmental Protection Regulation
Excellent Demographics (Growing Middle Class)
Fast Growing Economy

NEGATIVESQuestionable Rule of Law (Legal Rights and Copy-Right enforcement)
Closed markets to foreign firms
Inflation (Wages)
Inflation (Land)
Inflation (Raw Materials)
Inflation (Food)

If you are getting the point that I'm most concerned about inflation in the emerging world, you'd be right.  We don't need to look further than Tunisia, Egypt, Jordan, Yemen and Oman to see that poor, unemployed, youth ultimately rise up and look to change the leadership and rules of the land.  The food inflation and poor employment may have been the final straw that broke that cause the Tunisians and Egyptians to revolt, but these are real issues that we must examine in our favorite countries like Singapore, Malaysia, South Korea, Taiwan, Thailand, Chile, India, and Indonesia.  To clarify, I tend to think that China is further along in its emergence than the others that I've listed, and in fact is now had such an improvement that it is losing manufacturing business to the other Tigers because wage costs are increasing in the mainland.

I think the story I found here describes the wage situation in China quite well.
- http://business.globaltimes.cn/china-economy/2011-01/617201.html

The story describes a situation where living costs are now growing at such a clip that workers are simply walking out of their jobs and not returning from their Chinese New Year holiday since wages are not enough to pay their living expenses.  The impact of this is that manufacturers are being forced to delay shipments to the world (for useless junk we don't need).  This means that US retailers can't get the products that they have ordered.  Finally, the Chinese government is attempting to force wages up with regulations requiring minimum greater minimum wages.  In time, this will help and will create a huge domestic economy --- the economy all of the US multi-nationals have all been dreaming of for the last 20 years (remember Dell salivating about making manufacturing plants in China in the late 90's).  This future huge economy is what I've discussed for a while as the reason for investing in the emerging markets.  I've said it a few times, there will be really big draw downs, but in 20 years we'll be giving each other high fives for investing in these gems.


OK, THAT'S A GREAT LONG TERM VIEW, BUT WHAT ABOUT NOW?  - TECHNICAL TRADING UPDATE
Take a look at the two charts above, but let's start with the the colorful black one right above this section.  What we see here is that FXI has pretty significant support at $42 and overhead resistance at $47.  The biggest concern we have is the lower channel trend line that was recently broken last week.  This action to me spells further weakness.  If the $42 area of support breaks FXI could easily trade down to $36 ---- (another 15% or 20% from here).

Finally, examine the upper chart.  I use this chart to examine the 14 day EMA and the 40 day EMA on a weekly chart.  Typically when we see the breakthrough of the 14 day EMA below the 40 day EMA it is a harbinger of doom!  (ok, that may be a bit dramatic, but it isn't a positive).  For me, when this signal appears it signal is a longer term sign that the trend has turned negative.  Let me be clear, it has not crossed below yet, but when it does, it may be a great opportunity to short.   I've posted many articles about this signal in the past, one of the best has been VLO where it signaled a positive move up when the stock was in the $18 - $19 area in November 2010.  That signal (along with good fundamentals) has proved to be an awesome long term trade.

Keep watching, but with continued inflationary forces bruising the Chinese economy along with a confirmation of the 14 day EMA/40 day EMA crossover, I'd be inclined to trade this.

Sunday, December 5, 2010

DECEMBER MACRO UPDATE - RALLY ON THE FED'S DIME!

DECEMBER

RAILS - http://railfax.transmatch.com/

Last weeks' rail data continues to show overall strength in rail shipping compared to 2009 and 2008 . There are new "red" levels however that may be signs of slowing, but as usual I'll watch and not get too worried or excited.  Autos do pop out as an issue especially since the volumes are just so poor.  I heard over the last week that at least one of the automakers (GM) was going back to their old games of stuffing tons of inventory on the books of the dealer lots and this was allowing them to make it look like production was strong and sales great.  Think about it, wouldn't you do anything and everything you could to enhance your numbers going into an IPO?  As that surge has hit, perhaps that is a reason for the slowdown in auto shipments.

TOTAL RAILS - (4 WK ROLLING AVG) - http://railfax.transmatch.com/
2010 has been a much stronger year for rail shipping as you can see in the 4 week rolling average comparisons.  We also see that the 4th quarter is one that will lead to a decline in volumes. 
AUTOS - http://railfax.transmatch.com/Perhaps I'm just believing the stuff I hear on CNBC that suggests that everything is better in the world, but I am shocked to see that the auto shipment data below is highlighting an early "cooling" in the auto space.  Obviously there is a seasonal component to this, but it looks to have come a bit early compared to last year (and 2008 too).  


WASTE / SCRAP HAULING - http://railfax.transmatch.com/

No real changes here.  We'll see some data later on in the post that still continues to show scrap prices that are increasing.


(NEW INDICATOR) - PULSE OF COMMERCE INDEX - http://www.ceridianindex.com/
As many of you know I've been wanting to find a good index for tracking of trucking metrics.  I've found one here I believe where much of the work is done for us.  Ceridian in connection with UCLA produces real time data on the pumping of diesel fuel for inter-state commerce trucking.  They put those figures into an index level we can track. 

The key reason that I want to track this metric is that I believe that much of the improvement in rail shipping is a result of a purposeful attempt by truckers to use intermodal shipping to become more efficient.  In the beginning stages of the recovery we heard often that the increase in rail traffic was simply due to the fact that the economy was getting so much better.  I started to doubt this because I was seeing more and more traffic on a rail crossing near my home that contained more and more JB HUNT tractor trailer containers.  Yes, I've seen this before, but not in these volumes. 

My thought was simply that JB HUNT was making smart business decisions to avoid paying drivers and shipping those containers across the country.  This all makes sense as long as fuel costs are high and rail shipping rates are low.  I'll continue to monitor these levels and post them monthly.

Here is the key takeaway.  The October data shows the first 3 month decline in activity since the recession levels of January of 2009.  WE SHOULD NOT BE SEEING A DECLINE IN OCTOBER, IT SHOULD BE THE STRONGEST MONTH OF THE YEAR in anticipation of the holiday retail sales season.  This is an indication that the first quarter industrial productivity and other metrics will be lower than expected!

Finally, while I spend a ton of time looking for these data sources, my friend Carzz at http://blog.rebeltraders.net/ sent me the link and I appreciate it.  If you find an indicator you think is worthwhile, send me an email.


MIT/MOODY'S - http://web.mit.edu/cre/research/credl/rca.html
Property prices in September did rebound on the MIT/Moody's National Transaction Index for Commercial Real Estate.  While I'm very giddy that we continue to maintain a base here, I simply am awestruck by the magnitude of this drop.


NAR AVERAGE HOME PRICE - http://www.realtor.org/research/research/ehsdataExisting home sale prices rebounded a few hundred dollars in the latest report from our friends at NAR showing October prices.  As I've mentioned quite a few times it is so distressing to see how negative the impact the government's program of the housing stimulus was on buyers.  In June and July of this year home prices rocketed up to an average of $230,000 per home as the tax incentives were being doled out.  Now, just a few months later we see that home prices have fallen to right at $219,000 or a shocking $11,000 decline from the artificially high watermark.  So the take away from the entire program is that buyers received $6,000 or $8,000 in "credits" in order to buy a home that was overpriced by at least $10,000 while the taxpayer ultimately provided those "credits".  What a great stimulus.  What a disaster.  And we believe that any ideas to get this economy going by these clowns are going to work?

Clearly the only winners in this debacle were the mortgage companies, banks, realtors, appraisers, and inspectors.  Guess what, these were the same winners from the last round of real estate fraud we just endured in 2003-2007.  We won't learn.
  

MONSTER.COM EMPLOYMENT INDEX - http://about-monster.com/employment-index

The Monster.com Employment Index for November was released and we continue to see a decline in job offerings on the web.  This "leading" indicator should be worrisome as it is a reversal of the employment picture that we need to keep the economy afloat.  The is the second monthly decline since the September high of 138.

WLI - ECRI - http://www.businesscycle.com/resources/
The weekly leading indicators report from ECRI shows a tick up in again as we are in the area of the index at 125 where we were in May of this year.  The WLI is indicating that improvements are coming.


SCRAP METAL COMPOSITE INDEX - http://www.scrap.net/cgi-bin/composite_prices.cgi?id=100000&num=5
Scrap metal continues to make new highs and we should be taking notice.  Our old mentor Alan Greenspan taught us quite a lot about blowing bubbles and this indicator was one of his favorites.  We must also assume that since Mr. Greenspan felt like it was an important indicator, that he must also feel strongly that it's direction must also be up and to the right to signify that there is health in the economic market.  Therefore, Mr. Greenspan and his younger protege Ben Bernanke must be giddy with the conditions they are seeing now (at least without any corrections for the declining value of the dollar).


COPPOCK TURN INDICATOR -
The Coppock 14-month average indicator is still signaling bearish warnings although it has done so for quite a while.  As with every month I warn that this indicator isn't great in the short run.  To give you perspective, the Dow would need to hit 11,900 by December's close for the indicator to actually signal a buy.


BLOOMBERG FINANCIAL CONDITIONS INDEX - http://www.bloomberg.com/apps/quote?ticker=BFCIUS:IND
The Financial Conditions Index again went positive this week as the slosh of liquidity and ever levitating assets in the markets continue their move.  The index's move above 0 reinforces the idea that we are in an expansion phase (not recessionary).  As we have seen all too many times recently the improvement is quite fragile and any shock to the system could put the recovery in doubt as signaled by the BFCI.


BALTIC DRY GOODS SHIPPING INDEX - http://www.bloomberg.com/apps/quote?ticker=BDIY:IND
The spot rate for shipping bulk dry good commodities across the world is back down again.  It would really stink to be a shipper with high amounts of debt, of course there are none of those out there in the world, so carry on!  There were some good things going on with shippers like DRYS as they reported good earnings and that they had locked up shipping rates for almost 80% of their fleet for 2011.  I guess that is good news since the index rates are dropping.


USD - http://www.bloomberg.com/apps/quote?ticker=DXY:IND
The USD Index below shows that the work of the FED has been quite successful since the scare back in May of this year.  Remember in April when we were so worried that a little country like Greece could destroy Europe and the Euro?  Those days seem like forever ago don't they?  With a few clicks of the key board Uncle Ben has printed the USD into the abyss and pushed asset prices up, up, and away.  In November, we had a bit of fear return as a little country named Ireland came into the news.  Concerns over their banks and balance sheets have caused the USD to gain some traction.  Never fear though, all is well in Europe and all it has taken is a few days in December for the USD's plunge to continue.  There is no doubt that there may be a few more countries at risk in Europe, but a steadfast IMF and FED can do anything to bolster our confidence. 


Here's a very quick summary.  We've got the WLI and BFCI moving higher but those are often simply derivative metrics that show the power of liquidity provided by FED.  Trucking and employment are slowing and then we had that interesting employment report on Friday.  Despite the mixed signals, it doesn't matter, as long as USD dives, all other assets rise.  Nothing to see here folks!


DECEMBER TRADING UPDATE -
The FED set the tone last month with the reaffirmation of the QE II strategy.  As bearish as you want to be you cannot avoid the coordinated global efforts of the FED and central bankers to push markets higher.  Whenever there is  a move to adopt some sort of reasonable approach to fiscal responsibility, a crisis like those in Europe seem to raise their heads and force leaders to cow to the religion of more liquidity.  Last month was one of those key months where I felt like I was finally getting back in tune with the market where I was anticipating moves down and feeling strongly that they were opportunities just to add more.  The first few days of December have validated those convictions and my purchases of commodities and emerging markets in the face of these corrections have been rewarded. 

There is no doubt that there are issues in China and other emerging countries as they try to step on the brakes to keep from overheating as inflation is clearly hitting.  Due to this it is important to watch continuously and is the reason that I have not added to my emerging markets positions in November.  In my opinion, the overall trends in the US market and commodities markets are still higher (based on a falling dollar of course) so I'll continue to beat the drum of metals, energy, and commodities.  Remember, we have at least 4 or 5 months more of QE II right? 


While the signs of contagion in Europe have been contained for a day or two we know that this problem is not solved.  I can think of a scenario where we begin to see another crisis in February and March along with an undeniable slowdown in the US from a terrible holiday season.  This is where I am looking to see the correction that has so far been non-existent and long over due.

The headlines and concerns we are reading about the Bush tax-cuts expiration are a story to watch, not because I believe they will not be passed, but in the fact that this story may be the catalyst for another downward move in the markets which will provide yet another opportunity to add to positions or reposition poorly allocated investment dollars.  If Congress does not approve the cuts by 12/31/2010, the incoming House will simply pass a measure and retroactively date them to keep them in place for at least another year or two.  The Obama Administration will hate it, but will sign the measure.

I have two updates on individual positions.

VLO
Take a look at this long-term weekly chart of VLO. The 14 day EMA just crossed over the 40 day EMA (200 day MA). This should be quite bullish. I have no position just yet, but it is compelling. As we see a strong follow through move here over $21 will have me looking for a gain to $24.00.


NFLX
Followers on Twitter noted that I made a call to short NFLX right as the FCC Chairman stated that he supported the idea that distributors of content on the web should or could be made to pay for their consumption of bandwidth on the web and couldn't simply force it down the pipe and consume the infrastructure and resources of the highway providers (ISPs).  Immediately I decided to short NFLX since they provide huge packets of data and flow them downstream to end users without paying for the cost of the highways to folks like AT&T and Comcast. 

The trade was entered at $202.50 and I have a target of $179.00 and $165.00 for exit.  As always, when I have decent gains I begin to get focused on harvesting them.  At $179 I will sell (buy) half of the position back and look for a further drop to the $165 area. 

BE CAREFUL!

GOATMUG