Showing posts with label ECRI. Show all posts

Friday, October 21, 2011

OCTOBER MACRO UPDATE (Rumors and Rumors of Rumors)

OCTOBER MONTHLY MACRO ECONOMIC UPDATE

I took a month off last month and it was very good to have a break.  I'm excited to "get to" put this together and see what the data is telling us.  As of Friday, October 21, the equity markets have stabilized a bit after a thrashing and we are back to the 1235 level on the SPX.  Earnings have been mixed and there have been some misses that shocked the world and then some beats that have been quite good.  Overall, I didn't expect this earnings season to be all that bad, but the next one should be more than interesting. 

Investing in these markets is quite perilous as 2% moves up and down intraday are not signs that we are investing in a healthy market.  Rumors and rumors of rumors result in absolute face-ripping turns that can leave your rear and your portfolio aching.  It is important that you slow down and remember the risk rather than focus on the money you are not making by being in a trade.  I've had several email conversations this week with people that were upset they were "missing it".  Don't worry, there will be another trade after that one.

Let's dive in shall we?

RAILS  - http://www.aar.org/NewsAndEvents/~/media/aar/railtimeindicators/2011-10-rti.ashx
2011 continues to track right on par with 2010 on a non-seasonally adjusted basis.  From an economic perspective one might suggest that this is bearish, yet oddly I find myself noting that despite all of the ominous double-dippiness that I see, it is quite positive to see that we are tracking right along with last year and not falling.  This is based on the assumption that many folks have that 2009 and early 2010 were essentially pulling forward all sorts of demand (and that was the case for cash for houses and cash for clunkers), but at least in the midst of this "pull forward" 2011 has been able to match that transport demand punch for punch.


US Carloads - 52 Wk Moving Avg -
What does this graph tell us?  Simply that we are better off now than we have been in terms of moving stuff compared to anytime in the last 2 years.  It is not a huge revelation to note that we are not near the 2006/2007 excessive peak of everything.


Crushed Stone - I've finally found a reporting source for crushed stone transportation since Railfax went to a subscription model (greedy 1%ers!)  Here we find much the same that 2011 is right on target with 2010.  Unfortunately for commercial builders, this indicator is telling us that there is no real demand for commercial building at all.


MANUFACTURING INVENTORIES
Here is nice graph I pulled from the Railtime report that highlights a concerning trend.  See the red line there?  That is showing that since March of 2009 manufacturing inventories were at significant lows.  As we've mentioned often, the red line demonstrates that the climb in inventories has fueled much of the consumption of raw materials and the illusion that the economy is a lot better.  Now that we are near peak levels reached in 2007 and 2008, where do we go from here?


ECRI - Weekly Leading Indicators - http://www.businesscycle.com/
The WLI from ECRI continues to show weakness and point toward a "new recession". 


6 MONTH EURIBOR - Charts
Euribor continues to remain stubbornly high for this type of credit environment.  Euribor is the rate in which banks can borrow from each other in Euros.  While the absolute levels here are nowhere near the highs of the past in "normal" credit markets, given the scary lending environment the Eurozone is in now, the uptick in rates over the last two months is indicative of the stress between counterparties.  Despite being told that a solution is in the works to the Greece solvency problem, we've seen other dominoes fall.  The "dominoes" are weak banks that are exposed to bad sovereign debt.  These include Dexia, and a few other French banks.  These rates seem to be on their path higher.....again.


PULSE OF THE ECONOMY - http://www.ceridianindex.com/
I'll be very interested to see the results of next months report from the UCLA/Ceridian Fuel Index.  Readers should recall that the Ceridian Index monitors the fill-ups of truckers across the country and in turn, this fueling activity gives us an idea of how the economy is doing in real-time.  Over the last couple of months we've seen a slow-down in these figures and this is an indication that a recovery is on the skids.


MONSTER.COM INDEX - http://about-monster.com/employment/index/15
The Monster.Com Index shows a reading of 148 which is actually very good.  The print represents a 7% year-over-year gain, but more importantly the figure is the highest level we've seen in a very long time.  The Monster.Com Index measures the number of on-line job listings available.  Obviously in this graph you can tell that September is seasonally the most active job posting month, but when we continue to hear that there are just no jobs available, we must question the common wisdom.  Perhaps some of the OWS guys can use some of their down time to hop online and apply for one of those "fair wage" jobs they are demanding.


HOME SALES - Uh oh. - http://www.realtor.org/research/research/ehsdata
Home sales prices are beginning to fall again.


MIT / MOODY's REAL TRANSACTION BASED INDEX - http://web.mit.edu/cre/research/credl/rca.html
The late September release of the MIT/Moody's Transaction Based Index show some positive news, however the release captures data from the month of July.  The month of July noted an increase in transaction price of 5% which is quite good given the circumstances of the economy.  Obviously the follow on months of August and September will be critical and we'll keep watching them.


SCRAP METAL COMPOSITE INDEX - http://www.scrap.net/cgi-bin/composite_prices.cgi?id=100000&num=5
Alan Greenspan better take notice as scrap metal prices are plummeting.  Since their peak in February, metal prices have fallen.  Mr. Greenspan used scrap metal as an indicator for the health of the economy.  I'm wondering how healthy the economy looks given the almost 20% drop in the index.


FINANCIAL CONDITIONS INDEX - http://www.bloomberg.com/apps/quote?ticker=BFCIUS:IND
Bloomberg's Financial Condition Index is also suggesting that we are in recessionary territory.  Any level under 0.00 gives us the information that the economy is contracting.


BALTIC DRY GOODS SHIPPING INDEX - http://www.bloomberg.com/apps/quote?ticker=BDIY&exch=IND&x=15&y=11
After reaching multi-year lows in February, the BDGI seems to have found some footing.  and the spot rate shipping index has almost doubled.  Unfortunately we need to resist the desire to rush out and buy shippers as I recently read a story that noted that shippers have another huge delivery of ships coming online in the next several years.


USD INDEX - http://www.bloomberg.com/apps/quote?ticker=DXY:IND
The dance of the USD continues as each Eurozone fix rumor creates massive gains and losses in the USD.  September's spike in the dollar has been met with October's destruction in the greenback.  The volatility will continue till we see some sort of resolution from the ECB, IMF, and Euro countries.  A very cursory look at this chart suggests that their may be a small move higher in the dollar and then a continuance of the larger trend down to retest 74.  If that does happen, the equity markets will enjoy a healthy rally.


COPPOCK INDICATOR -
Well I've kept the Coppock Indicator warmed up and up to date despite my belief that it is pretty worthless.  I've tracked this indicator for more than a year now and as I noted when I started, it didn't have much predictive power, and doesn't seem to have much still.  Recently I did a post on the notion that the slope of the moving average had something to do with the predictive capabilities, but I'm  not sold.  Needless to say, the Coppock Indicator for September was still in "sell" mode and thus the big rally over the first weeks of October would have been missed.  Coppock needs a close over 12,500 to earn a buy turn signal.


MACRO SUMMARY -
As bearish as I sound on many posts, I am not as bearish as I could be and actually feel a bit positive.  Employment measured in the Monster.com Index is up, real estate transactions (commercial) are getting better, rails are shipping as much or more than last year, and input costs are falling (copper, scrap, etc).  There are serious headwinds, most notably a lack of any confidence in the sustainability of the "recovery" and of our leadership in the political sphere.  I think this is exactly the kind of environment that could foster upside surprises in terms of economic performance since everyone is just so darn pessimistic.

TRADING UPDATE -
The last two weeks of rallying has saved the bulls and charts have made some really compelling progress to bolster the bullish case.  As I type this, I am reminded that these markets have tended to move into territory lately that "bolsters cases" and then suddenly destroys that case in an instant.  With that in mind we'll pretend that the Eurozone issues don't exist and we're simply going to look at the charts and attempt to discern where we could go!

$SPX looks strong here for a move to the 1275 area as this would be essentially the 200 day moving average.  As I discussed in the earlier USD chart, this type of move higher in SPX would result as a drop in the USD paved way for the equity market rebound.


14/40 CROSSOVER - On a much longer time frame we get a sense that perhaps all things are not well with the indices as we see that on the 14/40 chart of $SPX that the 14 Day EMA on a weekly chart is still below the 40 day EMA.  This is essentially still a hold bonds not equities signal here.  While not pictured here, the MACD is turning up, but that doesn't change that the longer term call here is still bearish till we see a cross back over.


Finally, let me share with you a couple of perspectives on specific names.

FCX - Put this one on your watch list.  I have been playing this one long and short all week, but am out of the name as of today.  The move into the $36 area from the $34's yesterday makes this one in no-man's land.  However, if we do see a continued rally in the Euro, we'll see commodities run up and FCX has been strong despite falling copper and gold.  A continuation of this could lead to much higher prices in FCX near the $45 level.  If we get a move to $38.25 and it is repelled, it might be a good play to short.  If $38.25 holds well, a short trade may be the play with a low $32 handle as a target.  In the near term, here are the levels I am watching.

Bullish - Resistance at $38.25 if goes through there, $45 is in play.  Lower support at $32.60


INTC - While the FCX play is bullish I have been watching and shorting Intel.  Oddly, I actually like INTC alot, and had identified it as a great "defensive" name due to the high dividend when the stock was trading near 19.00.  Unfortunately I missed that entire run as I was over thinking it.  Now, despite my admiration for the dividend and the good results the company posted, I find that a 30% + move in a couple of weeks is just too much.  Look at how INTC has struggled at the $24 level.  If this isn't a good opportunity to short, I don't know what is.  I'm setting a tight stop at $24.75 and letting this one go with a target of $21.50 as a retracement to the 50 D MA and then possibly a $19 target again where I'd then flip and go long.  Finally, you'll note on the chart that INTC is at a point that is 2 standard deviations above the longer term average which is essentially the 200 day.  This seems that the move up has been a bit overdone, therefore it reinforces the bearish posture in this trade.


Well, that's enough for me today.  Please check out the blog often as I'm back and enjoying my publishing outlet again!

GOATMUG

Goatmug is an investor that cares about you and your family. Goatmug's Blog - Financial Perspectives From The Mountain Top is a collection of thoughts on our economy and how it impacts the lives of investors and average people. While several specific investments are named in many of his posts, these articles are simply invitations for you to do your own research and reference to these securities does not constitute financial advice. Your situation is complex and unique and you should seek professional assistance with your trading and investing. Please visit Goatmug and share your comments at http://www.goatmug.blogspot.com/


Monday, October 3, 2011

GIVE ME A DOUBLE DIP OF RECESSION

Tom Keene from Bloomberg interviews Lakshman Achuthan, co-founder of the Economic Cycle Research Institute and they talk about the outlook for a U.S. recession.

 I don't know how it is possible to have a view that is bullish in this environment. I traded emails today with a person that is convinced that they need to be fully invested in the market and were attempting to find high dividend payers. Fine, I understand that if you are a mutual fund manager. I am not ok with that if you are an individual investor. In this kind of scenario you could lose 20% or 40% in a matter of a few months! A 4% dividend isn't going to make up for that kind of loss!

 So, as we examine this video, keep in mind the comments from Warren Buffett the other day, as he tells us that there is not a recession.


Here are just a few of the interesting tidbits from the video.

"This is not a double dip, it is a new recession." 

"If you think this is bad, we haven't seen anything yet."

 "Profits can be good, but I don't know where stocks go. We expect more frequent recessions so you have an elevated stock risk premium. Look at the case of Japan after the bubble burst, it is not that they didn't make any money, but the Nikkei is a quarter of the value."

Can yields go lower? -- "Yes, look at Japan"

IT COMES BACK TO THE FED IS OUT OF BULLETS
I'm becoming more pessimistic as I see more data from the US that is poor and then we have further deterioration in Europe and the emerging markets. Copper is signaling that things globally are turning anemic.

It doesn't seem like the fellas at ECRI believe it's all good.  Perhaps just the Warren Buffett rails and insurance companies, and furniture stores that employ 70,000 are doing fine.  I'm not a huge fan of ECRI's cop out that this is not a double dip recession, for them it is a new recession, because I think they missed the signs as the Fed blew up their model (revealing that much of ECRI's data is based on liquidity and credit just like the Financial Conditions Index.  Having said that, I believe their models are back to pointing in the correct direction because the Fed simply had to quit fueling the economy with additional printed propellant.  It won't be long until the Fed is back again with the Mother of all Stimuli.  If we see significant breaks with the Dow with a 8000 handle I think this will allow for the globally coordinated stimulus from all central banks that I've been waiting for.  Until then, we'll see support levels fall as the confidence in the US economy falters and the Eurozone mess goes into total meltdown stage.  Alas, there won't be the "decoupled" emerging markets to save us either.  We better get our deflation hats on, it is coming.

GOATMUG 

Goatmug is an investor that cares about you and your family. Goatmug's Blog - Financial Perspectives From The Mountain Top is a collection of thoughts on our economy and how it impacts the lives of investors and average people. While several specific investments are named in many of his posts, these articles are simply invitations for you to do your own research and reference to these securities does not constitute financial advice. Your situation is complex and unique and you should seek professional assistance with your trading and investing. Please visit Goatmug and share your comments at http://www.goatmug.blogspot.com/

Wednesday, June 15, 2011

WHEN SOFT PATCHES BECOME HARD LANDINGS - JUNE MACRO UPDATE

JUNE MACRO UPDATE -
I am back to publishing the macro update in one huge post again.  I found that trying to break it up might be good for web-traffic rankings, but doesn't do much for continuity and simply getting it done.  In fact, last month, I posted only half of the data.  To simplify life for readers and myself, I'll just post the whole enchilada here.  If there is too much, simply scan the pretty charts.  If you desire more detail or Goatmug's take on the data, simply read the fluff. 

RAILS - http://railfax.transmatch.com/

Rail traffic in the US continues to push higher in year-over-year comparisons.  We did see coal shipments under perform last year during this week.  So far year to date, only food tonnage is down from last year at this time.


TOTAL RAILS
We continue to see the improvement over last year's shipments, while the economy has encountered a "slow patch" it will be important to follow the trend to see if we see a further regression toward last year's totals.


CP - Regular readers know that I often examine individual rail company delivery statistics to try to catch an edge on short term trades, especially to identify outpeformers and poor performers.  Canadian Pacific continues to be a laggard that I'm watching.  It appears as though railfax had some data issues because we don't see the chart populated for the last several weeks, despite that, I don't see much change in the information from other sources.


UNP is barely exceeding last year's hauling numbers so I thought it would be one to put on our radar.  It is also notable that the only other rail that is showing negative y-o-y shipping totals is Ferromex which UNP owns a 26% stake in.  Don't pull the trigger on this one, just add it to your watch list as a potential short.


THE RECESSION INDICATORS - CRUSHED STONE AND CHEMICALS
Railfax continues to tinker with the information they provide and in fact are toying with the idea of limiting much of their data (boooo!).  In the last couple of years we saw shipping information on autos, scrap metal, and timber, but this month we are back to Crushed Stone and a new one, Chemicals.  Both of these metrics are good for gauging economic health.  Crushed stone is used in the commercial real estate areas and obviously chemicals are used in manufacturing, agricultural, and energy applications.  There is nothing shocking to report here.


MOODY'S/MIT TRANSACTION BASED INDEX - http://web.mit.edu/cre/research/credl/rca.html
If the Crushed Stone data didn't give us a tip off, the MIT Transaction Based Index sure will.  Once again the index is showing that real commercial real estate transactions are losing ground and seller's positions are weakening.  We note here that there was a 4.23% decline in March in the value of deals getting done.


MONSTER.COM EMPLOYMENT INDEX - http://about-monster.com/employment-index
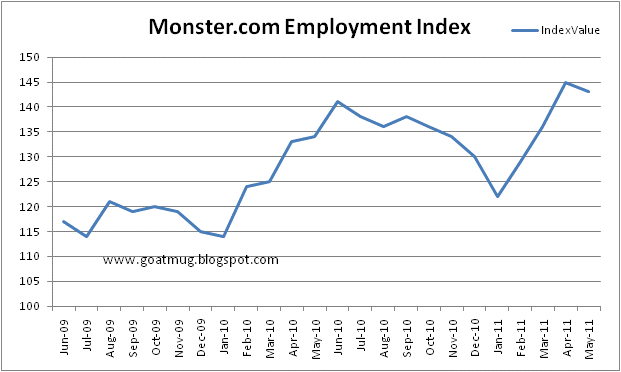
It all can't be bad right?  Despite the poor jobs reports, Monster Worldwide is showing some pretty positive numbers in terms of the number of job listings on Monster.com.  May dipped a little, but clearly April and May indicated that job listings are a a higher point than they have been for almost two years.  I'm generally pretty skeptical and negative about this economy, but this is a good sign.


NAR - EXISTING HOME SALE PRICES - http://www.realtor.org/research/research/ehsdata
The average home price is finally moving up and we'll call this a trend.  Yes, of course in some parts of the nation things are nasty, but overall we are seeing a pick up in the average home price.  Pricing is still at levels that are equal to the "pits of hell" of late 2009, but at least we're heading higher.  The recent drop in the stock market and resulting bid for treasuries may actually be a boon for housing data as mortgages rates are falling.  Now, the only trick will be for those scrappy realtors to find quality buyers to scoop up all those deals!  (I've had two conversations this week already with home sellers and realtors that have lamented about the inability of folks to actually borrow).


ECRI - http://www.businesscycle.com/resources/
I've decided to put the ECRI data back into the monthly packet, but have avoided populating my own graphs.  I'll simply highlight their information here about the trends in home prices, and while real home prices continue to dip, leading indicators for home pricing seem to show that there is some rebound happening.  This is of course backed up by the NAR data, which makes me feel better about the NAR data, because we've already seen that NAR economists are essentially an arm of the realtor marketing alliance.  They would never, ever, ever, come out and say that it wasn't a good time to buy, would they?  The area I live in has been totally insulated from much of the drop, so I feel like I live in some alternate reality where everyone I meet can afford a home that costs $1 million and more importantly can afford the $3,000 a month in property taxes that comes along with that house payment.  In that price range, things have been fine in my town, but clearly other parts of the US have not been shielded by such fortune.


In addition, we find the ECRI Weekly Leading Index information showing a downturn for the fourth consecutive week. I think this is one data set that has the market spooked and this is really why I brought this back out.  The "rate of change" is indicating that the "green shoots" are turning yellow and are wilting. 


SCRAP METAL - http://www.scrap.net/cgi-bin/composite_prices.cgi?id=100000&num=5
Good old Alan Greenspan used scrap metal as a bell weather for the economy's health, however perhaps we should say he used it for a measure of the health of a bubble.  If it's good enough for Uncle Al, it's good enough for the Goat!  Scrap prices hit the skids since peaking in February.  While the composite index has tried to build a base over the last two readings I am not sure that the downward trend has abated.  Frankly, base metal prices and all commodity prices have been under attack since Ben Bernanke's declaration that commodity price inflation is "transitory", so the correction is not surprising.  It is in the economy's best interest to see commodity input prices fall and relieve some of the stagflationary risks we are faced with presently.


UCLA / CERIDIAN FUEL INDEX - http://www.ceridianindex.com/
I find the Ceridian / UCLA Fuel Index study full of information, however I despise that it offers this data with a two month lag.  As I've often reminded visitors to the blog, this piece of data is great for confirming direction and slowdowns that have occurred in long term trends, we just have to deal with the dated data.  The PCI (fuel index) seems to have peaked in March and turned downward.  This study is so great because the PCI (fuel index) consists of real time (errr not so real time for us) data from commercial trucks.  Each time they fill up, they transmit the amount of fuel they consume.  This information gives us a powerful view into the real transportation activity and health in the nation's economy.


Despite all of the tremors related to Greek insolvency and all of the undeniable issues with the PIIGS, we see that 6 month Euribor is just under 1.75%.  Remember the amazing days when interest rates had a 3% handle on them?  Rates have been climbing over the last couple of month and are up almost 65% since last September.
In contrast to those really expensive 1.75% Euribor rates, we see that the 6 Month USD Libor rate is  down to an eye-popping .40%.  Unlike our friends across the pond, our rates have about 15% since last September.  Obviously "one of these pledges is not like the other".  The divergence between the two sets of rates continues to illuminate how differently our central bankers have attacked these problems.  Their leadership has attempted some sort of fiscal control and monetary restraint in an effort to actually begin steps toward normalcy, our guys have thrown caution to the wind and jammed rates lower and lower and lower. 

I always find that Bloomberg's US Financial Conditions Index is one of my favorites.  Yes, it has it's flaws especially since it is driven by liquidity flows and stock market gyrations, but despite that, it seems to tell the truth quite often.  Over the last month, we've seen a total meltdown in the FinCon Index and it has steered itself toward a sub-zero reading.  Anything below zero is a recession, while numbers above also indicate that there is growth.  We are in that no-man's land area where we can't say one way or another where we'll end up, but if we are growing, it isn't overwhelming, that is for sure.
In a valiant effort, the Baltic Dry Goods Index has battled through May to just under 1400 again, where it looks as though it may drop.


The USD has risen a point or so against an incredibly bad chart.  The buck is in a make it or break it position here, and if it doesn't hold these critical support levels, we'll see commodities off to the races with $140 oil within striking distance.  As we've discussed many times, the devaluation of the USD must be thought of as a dance, something that is choreographed and one that has a rhythm.  Our leadership simply couldn't "crash" the dollar, they have to walk it down gently or else the entire scheme would fall apart very quickly. 

LONG TERM VIEW OF USD -
If you had any doubt that your purchasing power had eroded, look now further than this graph to clearly understand what Alan Greenspan and Ben Bernanke have done to your dollar, business, family, and lifestyle.  In order to support bubble after bubble and keep interest rates artificially low, they have purposefully crushed the value of your currency.  Isn't paper money great?


COPPOCK TURN INDICATOR -
I've been keeping this one around for entertainment purposes only.  As if right on queue as soon as the Coppock signaled a reversal and gave a buy signal, all hell broke lose!  Interestingly, if the Dow Jones stays under 12,350 it will signal a SELL.  Perhaps the indicator will redeem itself after all.  Please note, according to Coppock rules, it is still in a BUY till the end of the month as these are monthly data inputs.


WHERE SOFT PATCHES BECOME HARD LANDINGS
William Dudley, NY Fed Governor said  recently that "Despite our recent soft patch, economic conditions have improved over the last year."  Typically Dudley, Yellen, and Bernanke are the only 3 Fed bankers that you need to pay attention to, because they are the driving force behind the Fed.  As you might expect, they usually support the same positions and don't ever go "off the reservation" like some of the other guys.  As many of you know, I believe the "other guys" are simply there to make it seem like there are honest discussions occurring at the Fed, when in reality all the other players matter little.

As I mentioned though, Dudley is one of the guys that matter, so I often make sure to read and re-read his statements because they are another read into Bernanke's views.  In fact, they often use the same words and language to describe our economy and its challenges.  In this case, Dudley gives us more of the reasoning behind the famous "commodity price inflation is transitory" because he lays out that our weakness in the economy is due to several key issues.  He states that rising commodity prices, the Japanese earthquake, and severe weather are passing issues.  Dudley goes further, just like Ben Bernanke and highlights that they can have faith in their notion that inflation is transitory because long-term inflation expectations are stable, BUT what is even more illuminating is that he says that these levels are now elevated and it does have the Fed concerned.  This is much less confident of a statement than what we heard from the Chairman in April. 

This is the rub.  The Fed still believes that it is in control of the situation despite the fact that it is having funding issues, has tremendous balance sheet risk when interest rates rise, and is backed further into a corner when commodity prices rise.  No wonder why we are seeing them impress upon us how small inflation is, how temporary it is, and how it really isn't anything to worry about.  These comments are part of the PR campaign to make expectations a reality. 

The problem with this "soft patch" is that many of the important metrics we are watching are still falling and weakening.  If the continued weakening persists and they can't force oil, gas, softs, and other commodities lower to kill longer term inflation expectations they'll be at risk for driving us off a cliff.  We've noted many times before that each basis point of interest rates cost us taxpayers billions, and this doesn't include all of the bad execution on treasuries we've bought at less than best prices.  If this soft patch gets any worse, we'll certainly be in for a hard landing.

TRADING UPDATE
I have continued to hammer home the idea that we've lived through this before.  We've endured the issues with falling economic metrics, a weak stock market, and political threats to collapse the financial world if the debt ceiling isn't raised.  Couple that in with a few legitimate jitters over the status of the Greek bailout and you have a perfect storm for trading challenges.  The question is really though, can the markets deal with it and still go higher?

Here are specific plays to think about over the next few weeks as you position your portfolio.

SECTOR ROTATION TRADES
Look, about 80% or more of professional money managers must be fully invested all the time.  As they perceive areas like energy and industrials to be more risky, they need to rotate out to the next thing.  In the sector rotation model I posted a couple of days ago we find that Consumer Staples, Defense, Utilities, and Healthcare are all part of that next step in the process.  I personally love cash, so I view these trades differently, as usual we need to know the game that is being played by portfolio managers that are trying to beat the index.  The gamble is that these defensives will lose less or outperform the risky stuff, therefore they can incrementally beat their benchmark and get paid their bonus.  We on the other hand have cash as an option, I'd use it too.

PPA (Defense)
XLV (Healthcare)
XLP (Consumer Staples)
XLU (Utilities)
Oh yes, I'm short a few technology names in anticipation of the rotation out and a slow down.  I'll highlight a few of these in other posts where I can give more specifics.

EUROPEAN COLLAPSE TRADES
GLD or physical gold would be the answer here.  Everyone knows this will be the final outcome, no one wants to end up holding the bag.

SUMMER DRIVING SEASON AND MORE MIDDLE EAST UNREST
Gasoline has continued to be a tough trade that has been very volatile.  I have closed this trade, but there is still a good potential for a move higher, one little hurricane in the Gulf of Mexico would move this solidly higher.

COLLAPSE OF THE DOLLAR TRADE (DEBT CEILING ISSUES)
EMLC - I like this play here, it is an etf constructed of sovereign and foreign debt in the local currency of the issuers.  If Bernanke is able to slide the value of the dollar  lower, you will gain in the currency play as well as the yields associated with these foreign bonds.

Physical gold or silver and GLD if you like fake paper stuff.  My view on silver and gold is oddly different here, I am a long term holder, therefore this is NOT a quick hit trade like I usually focus on.  Silver could easily test $32, but I still have a very large position in physical silver and it isn't going anywhere.  Who knows, I may need to kill an intruder with a 40lb brick of silver if we go Mad Max anytime soon.

That's it for the monthly update, I'll do more in the coming days about specific trades mentioned here and also reveal other positions that I have on now.

GOATMUG

Goatmug is an investor that cares about you and your family. Goatmug's Blog - Financial Perspectives From The Mountain Top is a collection of thoughts on our economy and how it impacts the lives of investors and average people. While several specific investments are named in many of his posts, these articles are simply invitations for you to do your own research and reference to these securities does not constitute financial advice. Your situation is complex and unique and you should seek professional assistance with your trading and investing. Please visit Goatmug and share your comments at www.goatmug.blogspot.com .

Friday, July 23, 2010

WHAT WE'VE GOT HERE IS A FAILURE TO COMMUNICATE

(As usual, please forgive the weird spacing issues on this site - The Blogger Editor is up to its old tricks again!  I've tried to fix the spacing issues by placing dots and bullet points to make the site readable.
                                                                                                                            
We did recover right?

  • ECRI DATA - http://www.businesscycle.com/resources/
The ECRI released its weekly data from 7/16/2010 yesterday and it is now showing a drop or growth decline of -10.5%.
Declines of this magnitude are absolutely indicative of a recession.  Now as I've mentioned, officially the NBER has not called the recession over, (I guess they have mental images of President Bush on the aircraft carrier), however by any stretch of the imagination economists should have declared the recession over with the managed recovery we've had.  Of course little things like employment and housing that have not recovered shouldn't stop a few economists and administration officials from stating the obvious right?

IF they did declare the recession over, this data would tell us that we were going to double dip with all doubt removed.  However, now that our friends have held off from declaring victory we may have the fabled L shaped non-recovery.
  •  


  •  

  •  
  • RAILS - http://railfax.transmatch.com/
Other indicators of slowing are showing up.  I will not post the data here, but rail tonnage is slowing and with carriers are even seeing declines versus last year.  Can you say WHAT?  I thought last year things were terrible and everything this year was all better?  I thought the US consumer was back and commodities were on a tear?  Me too.  Last week almost all categories of shipments were down when compared to 2009's easy levels and this week a few of the categories remain slow again (coal, autos, and food), that is slower than 2009 levels and much lower than 2008 levels.  KSU's shipping declined significantly and so did KSU in Mexico. 


  • EUROPEAN STRESS TESTS - STRESSED NO MORE?
European Stress Tests were released today and the US markets caught another surge higher.  The uncertainty is gone for now, but the weekend will give traders and portfolio managers time to examine the sparse details and released information provided in the sham tests.  Are we going to feel better about the solvency of the banks when they really didn't stress them and didn't analyze the cost of default of sovereign debt on their balance sheet?  The potential of country debt defaults is exactly what exposes these banks to their very death!  If Greece, Portugal, Spain, or Italy don't have debt problems then these banks don't have problems (don't even mention mortgage assets - that is so 2009, even though it hasn't been addressed, but don't let reality stop a rant!)  Isn't it ridiculous to think that the regulators ran this test and show the results like they've accomplished something?  Isn't it funny to think that 7 banks in Europe failed anyway?  Isn't it funnier to think our markets rallied on this news?

  • LIBOR -
No matter what, the real test for the veracity of this exercise will be the cost of funding between banks on Monday. If we see declines in funding rates, then we must believe that the farce had at least some meaning between other bankers. If we see Libor move out more, this will be the tip off that this wasn't the magic elixir that the regulators had hoped it would be. I'll be watching this chart and I'll have a post on Monday.  We've seen a decline of 6 bps over the last several weeks as stress levels have declined. We'll want to see this come down even more to verify that banks trust each other.  (LIBOR)
  •  


  •  

I'll leave you with the optimistic quote of the day from someone on CNBC right after the release.
"It's not that the banks are failing, it is that the banks have failed a level of stress, and they are taking steps to improve it".
Yes, I guess that is one way to look at it. To test how this view works with other applications, let's run it through the British Petroleum version of the stress test.
Say this with me ------"It is not that BP is failing to be a good company and manage the environment effectively, it just failed a level of stress, and they are taking steps to improve it". Feel better about the Gulf of Mexico don't you? I thought you might! Perhaps I'll begin to look at all failures with this view! It's not that they have failed, it is simply that there is a failure to communicate!

  •  
Have a great weekend!
GOATMUG